- Volume 58 , Number 3
- Page: 453–61
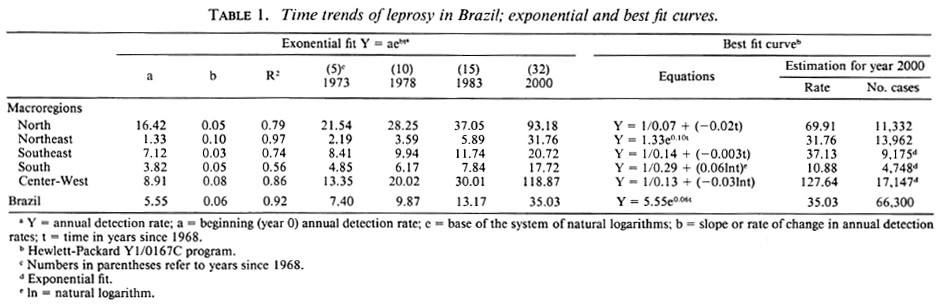
Time trends of hansen's disease in Brazil
ABSTRACT
In an analysis of the trend of Hansen's disease in Brazil, the "incidence register" or "detection rate" per 100,000 was used. The operational data analyzed were presumed to be related to true incidence because of the time elapsed (38 and 19 years) and because of the large number of cases. The statistical method used was the exponential curve fit. F rom 1950 to 1968, there was an average annual decrease in the rate of 3% as indicated by the regression coefficient (slope), but f rom 1969 to 1987 an increase of 6% per year was observed. If this last trend is sustained, the detection rate in the year 2000 will be 35.03 per 100,000 or, in a population estimated as 190,000,000 inhabitants, 66,600 new cases. For comparison, in 1983 there were 18,759 new cases registered. The trend analysis for each of the Brazilian political-administrative areas (states and territories) is more accentuated in the Center-West and Northeast Mac-roregions, with a slope of 8% and 10%, respectively. In some states, such as Paraíba, Rio Grande do Norte, and Alagoas, there were astonishingly positive slopes of 20%, 18% and 17%, respectively. The distribution of the new cases by clinical forms during most of the period studied (1969-1987) confirms the overall trends observed. There was an increase in the detection rate of the tuberculoid form of 5% annually -compared to the lepromatous (combined with borderline) rate of 3% per year-and, also, the increase in the tuberculoid form was greatest in the Center-West and Northeast Macroregions. In conclusion, there is a strong probability of an increase in the transmission of Hansen's disease in Brazil, a situation of great concern for public health authorities.RÉSUMÉ
Dans une analyse des tendances de la maladie de Hansen au Brésil, 1' "incidence d'enregistrement" ou "taux de détection" pour 100.000 a été utilisé. On a supposé que les données opérationnelles utilisées se rapportaient à l'incidence réelle du fait de l'intervalle de temps écoulé (38 et 19 ans) et du fait du grand nombre de cas. La méthode statistique utilisée fut l'ajustement à une courbe exponentielle. De 1950 à 1968, il y eut une diminution moyenne du taux de 3% par an comme indiqué par le coefficient de régression (pente), mais de 1969 à 1987, on observa une augmentation de 6% par an. Si cette dernière tendance se poursuit, le taux de détection sera en l'an 2000 de 35,03 pour 100.000, soit 66.600 nouveaux cas pour une population estimée à 190.000 habitants. L'analyse effectuée pour chaque région politico-administrative du Brésil (états et territoires), montre une tendance plus accentuée dans les Macrorégions du Centre-Ouest et du Nord-Est, avec des pentes de 8 et 10% respectivement. Dans certains états, comme Paraíba, Rio Grande do Norte et Alagoas, on observa des pentes positives de 20%, 18% et 17% respectivement. La distribution des nouveaux cas par formes cliniques durant la plus grande partie de la période d'étude (1969-1987) confirme les tendances générales observées. Il y eut une augmentation du taux de détection de la forme tub-erculoïde de 5% par an comparé à une augmentation de 3% de la forme lépromateuse (combinée à la forme dimorphe); en outre, l'augmentation observée pour la forme tuberculoïde fut la plus importante dans les Macrorégions du Centre-Ouest et du Nord-Est. En conclusion, il y a une forte probabilité que la transmission de la maladie de Hansen soit en augmentation au Brésil; cette situation est très préoccupante pour les autorités sanitaires.RESUMEN
Se utilizó el "registro de incidencia" o la "frecuencia de detección" por 100,000, para analizar la tendencia de la enfermedad de Hansen en Brasil. Se consideró que los datos analizados estuvieron relacionados con una incidencia verdadera debido al tiempo transcurrido (38 y 19 años) y debido al gran número de casos analizados. El método estadístico usado fue el de ajuste a la curva exponencial. De 1950 a 1968 hubo una disminución anual promedio en la incidencia del 13%, según se dedujo del coeficiente de regresión (pendiente), pero de 1969a 1987 se observó un incremento del 6%. Si esta última tendencia se sostuviera, la frecuencia de detección en el año 2000 sería de 35.03 por 100,000 o de 66,600 casos nuevos en una población estimada de 190,000,000 de habitantes. Para comparación, en 1983 hubieron 18,759 casos nuevos registrados. El análisis de la tendencia para cada área político-administrativa del Brasil (estados y territorios) es más acentuada en las macroregiones centro-occidental y nor-oriental, con pendientes del 8% y del 10%, respectivamente. En algunos estados tales como Paraiba, Rio Grande do Norte, y Alagoas, hubieron pendientes positivas del 20%, 18% y 17%, respectivamente. La distribución de los casos nuevos por forma clínica durante la mayor parte del periodo estudiado (1969- 1987) confirma las tendencias generales observadas. Hubo un incremento en la frecuencia de detección de la forma tuberculoide del 5% anual -comparado con el 3% anual para la forma lepromatosa (combinada con formas intermedias), también, el incremento en la forma tuberculoide fue mayor en las macro regiones centro-occidental y nor-oriental. En conclusión, hay una fuerte posibilidad de un incremento en la transmisión de la enfermedad de Hanscn en Brasil, una situación de gran preocupación para las autoridades de Salud Pública.The Hansen's disease endemic in Brazil was assessed through data supplied by the Brazilian Ministry of Health (8). There are a number of distinct epidemiological pictures, as can be expected, due to the geographical, climatic, and socioeconomic complexity of the country. The differences among the macroregions and the states regarding prevalence, detection rates, and time trends are the bases on which to establish objective criteria for priorities that would lead to better efficiency/efficacy of the control programs, directing the scarce available resources to areas where a greater impact on the endemic could be foreseen.
The main purpose of this paper is to analyze the time trends of the global and specific leprosy detection rates in Brazil with a breakdown for "macroregions" and "states."
MATERIALS AND METHODS
The "register incidence" or "detection rates" used were from data supplied by the Sanitary Dermatology Branch, Brazilian Ministry of Health (8), with a distribution by macroregions and states/territories: a) Detection rates for all of Brazil (not the political divisions) were available from 1950 to 1987; for all political divisions from 1969 to 1987. b) Data on clinical forms were available for the country as a whole and the macroregions from 1969 to 1987.
No data could be gathered concerning the distributions by age at onset, mean age, age groups, sex, or disability grades.
The statistical method used was that of "exponential fitting" expressed by the equation: Y = aebt
|
where Y =
|
rate at the year t |
|
a =
|
intercept of the curve |
|
b =
|
regression coefficient-slope-or yearly increase/decrease of |
| the rates | |
|
e =
|
base of natural logarithm |
|
t =
|
year; 1969 = 1, 1970 = 2, etc. |
The detection rate estimate for the year 2000 was computed by the "best fit curve" in a Hewlett-Packard YI/0167-C calculator program. All curves were approximated to a straight line by plotting the trend points on a decimal logarithm scale.
RESULTS
Figure 1 presents the time trends for two periods. From 1950 to 1968, a decreasing trend in the detection rates was observed with an average yearly decrease of 3% but with very low determination coefficient (R2), a clear indication of the influence of operational factors.
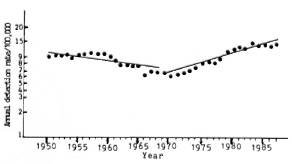
Fig. 1. Time trend of Hansen's disease in Brazil, 1950-1987, exponential lit (Y = aebt). 1950-1968: a = 10.97, b = -0.03, R2 = 0.58. 1969-1987: a = 5.55, b = 0.06, R2 = 0.92. Source: M.S.-SNPES-DNDS-Brazil (8).
In the following years, 1969 to 1987, the trend was distinctive: a steady increase in the detection rates with a slope of 6% yearly, the curve showing a high determination coefficient or goodness of fit -0.92. If this situation is sustained, the detection rate by the year 2000 will be 35.03 per 100,000. With a population estimate of 190,000,000 inhabitants by the year 2000, this means 66,600 new cases that year.
At the end of the period analyzed (1984- 1987), a trend for stabilization of the rates was observed. An analysis of Table 1 and the figures shows that in all five macrore-gions there was an increasing trend in the rates. The Northeast Macroregion had the highest slope-10% yearly average increase-and the smallest increases were seen in the South and Southeast Macroregions - 5% and 3%, respectively.
The North Macroregion had the highest detection rate, with an average annual rate of increase or slope of 5%, near the national average, followed by the Center-West Macroregion with a slope of 8%. The Northeast Macrorcgion had the lowest detection and prevalence rates-sec tables and figures- but it had the highest slope of any of the curves, a 10% average yearly increase, a trend that will put the region at the same level of new cases detected annually as that of the Southeast Macroregion by the year 1991.
The Southeast and South Macroregions had the lowest slopes or slowest rates of increase in the detection rates-3% and 5%, respectively.
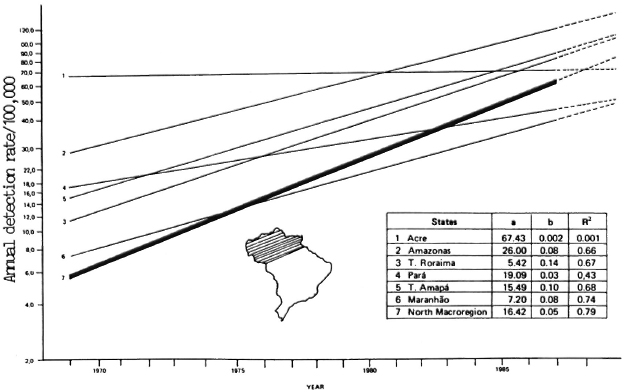
Fig. 2. Time trend of Hanzen's disease in Brazil's North Macroregion, 1969-1987, exponential fit (Y = aebt). Source: M.S.-SNPES-DNDS-Brazil(8).
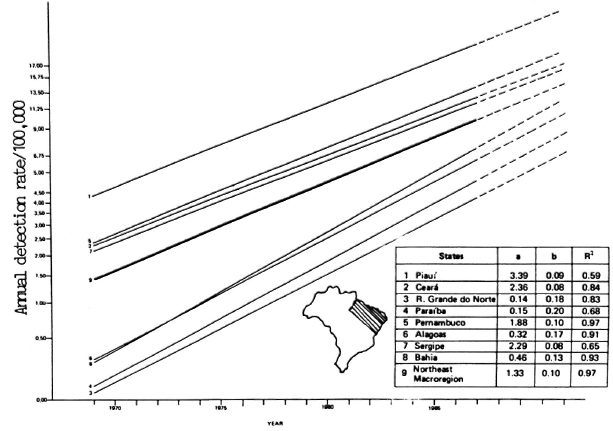
Fig. 3. Time trend of Hansen's disease in Brazil's Northeast Macroregion, 1969-1987, exponential fit (Y = aebt). Source: M.S.-SNPES-DNDS-Brazil (8).
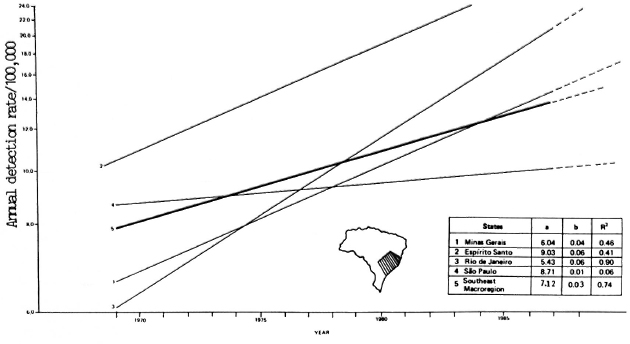
Fig. 4. Time trend of Hansen's disease in Brazil's Southeast Macroregion, 1969-1987, exponential fit (Y = aebt). Source: M.S.-SNPES-DNDS-Brazil (8).
It is worthwhile to note some of the variations in the detection rates within the same macroregion. In the North, the average annual detection rates in Acre State have increased but at the small rate of 0.02% per year with many variations during the period. The R2 value of 0.001 is too small to be reliable. All of the Northeast States had slopes of 8% or above, the highest being Paraíba with 20%. The average annual increase of the endemic level in São Paulo was only 1%. The Southern Macroregion, with only three states, had positive slopes of 6% and 5% in Parana and Santa Catarina with a reasonable fit, but in Rio Grande do Sul both the slope and determination coefficient were near zero.
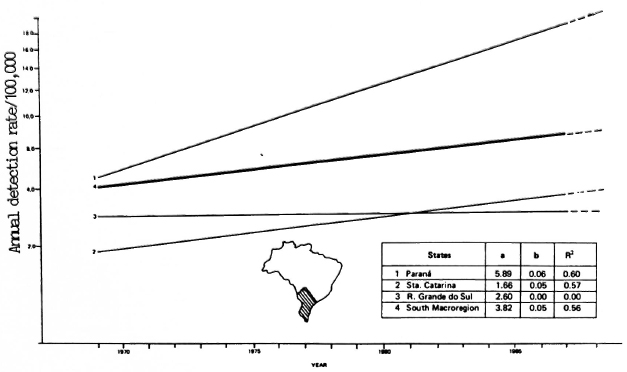
Fig. 5. Time trend of Hansen's disease in Brazil's South Macroregion, 1969-1987, exponential fit (Y = aebt). Source: M.S.-SNPES-DNDS-Brazil(8).
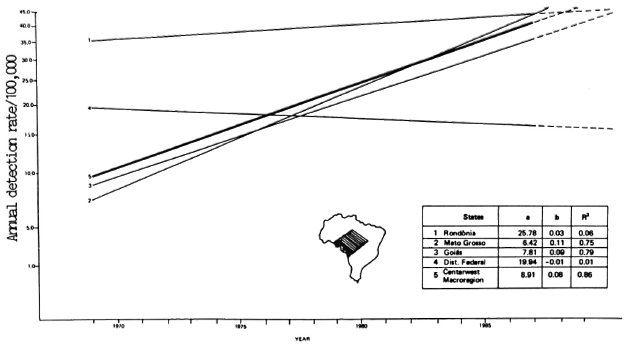
Fig. 6. Time trend of Hansen's disease in Brazil's Center-West Macroregion, 1969-1987, exponential fit (Y = aebt). Source: M.S.-SNPES-DNDS-Brazil (8).
Analysis of the trends in the detection rates by clinical forms between 1969-1983 showed an increase in the yearly rates for both forms, but the slopes were different; there was an average annual increase of 3% in the case detection rates for the lepromatous plus borderline forms and an annual increase of 5% for the tuberculoid form (Fig. 8). Tables 2 and 3 show the variations in the percentages of the clinical forms and the detection rates of the clinical forms in the five macroregions of the country. There were significant increases in both the percentages and the detection rates of the tuberculoid cases, mainly in the Northeast, Center-West, and North Macroregions.
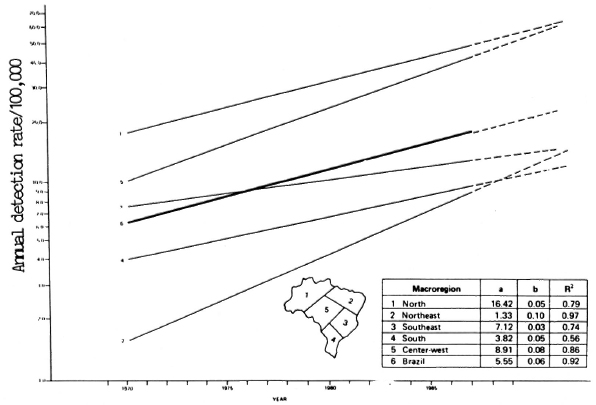
Fig. 7. Time trend of Hansen's disease in Brazil, 1969-1987, exponential fit (Y = aebt). Source: M.S.-SNPES-DNDS-Brazil (8).
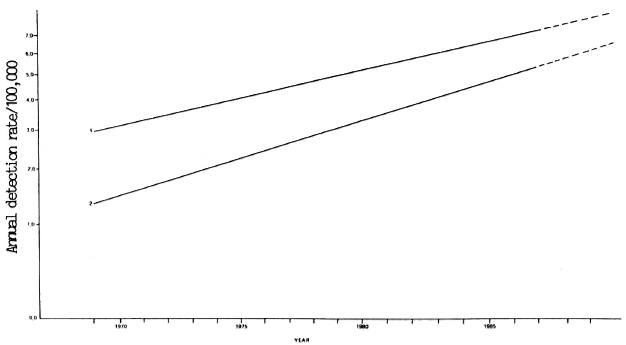
Fig. 8. Time trend of L+B and T forms of Hansen's disease in Brazil, 1969-1987. 1 = Lepromatous plus borderline forms, Y = 2.89e0.05t; R2 = 0.91. 2 = Tuberculoid forms, Y = 1.27e0.08t; R2 = 0.92. Source: M.S.-SNPES-DNDS-Brazil (8).
DISCUSSION
The trend of a communicable disease is assessed by the yearly incidence rates. However, in hanseniasis, due to the peculiarity of its epidemiology, the "register" or "detection" rates are used, the numerator being the number of cases diagnosed as new. Theoretically, it would be better to use the year of the disease "onset," but in Brazil these data were missing or unreliable in many states (8). Relying on the efficiency of the case-finding activities, the detection rates observed may be near or may be far from the actual incidence, but if no gross variation occurs related to operational factors, the detection rate can indicate the trend or how the endemic will increase or decrease in the future. The validity of the method of trend analysis (curve fitting) is directly related to the magnitude of the data (number of patients) and the observation time. Also, the determination coefficients (R2), if high, indicate a real trend (7-9).
The decreasing trend observed from 1950 to 1968 (Fig. 1) was 3% yearly, but the R2 of 0.58 reflects the operational situation in that period. Data registration was poor, policy guidelines were not clear, and personnel training and motivation were deficient. From 1969 to 1987, the states' control programs were improved by the implementation of technical guidelines, decentralization of case-finding and case-holding activities and, also, better logistic facilities. The observed R2 of 0.92 for this period strongly suggests that the endemic is really expanding, detection rates of near 6/100,000 in 1969 increasing to 17/100,000 in 1987.
A combination of more specific parameters (age, sex, clinical forms, and disability grades) would be valuable data to assess the endemic trends. Some studies (1,7) reviewed by Ferreira, et al. (2) seem to indicate that in regions of high prevalence the tuberculoid form predominates and the distribution by age shows a shift to the left (lower mean age of the new cases). Studies in countries with a declining endemicity for han-seniasis (3,4,6) support the concept of a predominance of multibacillary cases according to Irgens and Skjaerven (5), due to a longer incubation period and older age at the time of infection.
In Brazil, the results stated in this paper- a) a lower rate of increase in the detection rates of lepromatous (plus borderline) cases than the tuberculoid ones, and b) the curves with high determination coefficients - strongly suggest that the increasing number of cases being detected is due not only to a better awareness of the problem by the health units, associated with an expanded coverage of the population, but that it is also due to a real increase in the transmission of the disease. It is interesting to note that the higher differences between "rates," "proportion" or number of multibacillary to paucibacillary cases (Tables 2 and 3) correspond to the Northeast, North, and Center-West Macroregions where the highest determination coefficients were observed. The observation of a stabilization of the detection rates at the end of the period analyzed (1984-1987) could indicate a new trend, but only further studies will confirm this.
In conclusion, it is evident that the Hansen's disease endemic in Brazil has taken an increasingly epidemic curve, even taking into account operational factors and the lack of a more reliable system for collecting and registering the data. The observed increase affects the entire country, and seems to indicate that the problem is serious, not only in areas of known high prevalence (North and Center-West) but also in the Northeast. The findings confirm a previous study by one of us (8) who used the same methodology but plotted the number of cases and not the rates. The analysis of the distribution by clinical forms agrees with the overall morbidity rates. The rates of increase in the case-detection rates (slope) were greater in the tuberculoid form, and in precisely the same regions where the overall disease detection rates were showing the most marked increases.
It is hoped that the data presented here will stimulate others to conduct epidemiological studies to elucidate which factors are contributing to the sustained increase in the number of new leprosy cases, and that these data will motivate the health authorities concerning the seriousness of the situation.
Acknowledgment. The authors wish to thank the Division of Sanitary Dermatology, Ministry of Health, Brazil, for providing the source data.
REFERENCES
1. Bechelli, L. M. and Martinez Domínguez, N. Evaluation of leprosy control programs: some suggestions for operational and epidemiological assessment. Bull. WHO 42(1970)631-634.
2. Ferreira, J., Bernardi, C. D. and Gerbase, A. C. An analysis of leprosy incidence by patient age and the clinical form of the disease. Bull. Pan. Am. Health Organ. 18(1984)400-403.
3. Gupte, M. D. Review of present knowledge in epidemiology of leprosy. Geneva: World Health Organization, 1983. Lep/Sg/WP/83.2.
4. Irgens, L. M. Leprosy in Norway. Lepr. Rev. 51Suppl.(1980)1-130.
5. Irgens, L. M. and Skjaerven, R. Secular trend in age at onset, sex ratio and type index in leprosy observed during declining incidence rates. Am. J. Epidemiol. 122(1985)695-705.
6. Lechat, M. F. and Vanderveken, M. Basic epidemiological indicators for monitoring leprosy control. Tokyo: Sasakawa Memorial Health Foundation, 1983.
7. Noordeen, S. K. Evaluación epidemiológica de la lepra. Seminario Bolivariano Sobre el Control de la Lepra. Geneva: World Health Organization, 1983, pp. 65-74.
8. Yearly reports, 1950-1987, National Sanitary Dermatology, Brazilian Ministry of Health.
9. Zuninga, M. G. Evalucion de la endemia de la lepra en las Americas y proyecciones para el anno 2000. Seminario Bolivario Sobre el Control de la Lepra. Geneva: World Health Organization, 1983, pp. 100-123.
10. Zuninga, M. G. and Castellazzi, Z. 30 Anos de Evolución de la Endemia de la lepra en Venezuela. Caracas: CEPIALET, 1982.
1. M.D., Coordinator, Hansen's Disease Control, Rio de Janeiro State, 81/912 Av. Graca Aranha, Centro, Rio de Janeiro, R. J. 20.030, Brazil.
2. M.D., M.P.H., Epidemiologist, Instituto de Biomedicina, Apartado Postal 4043 (Carmelitas), Caracas 101, Venezuela.
Received for publication on 7 December 1988.
Accepted for publication in revised form on 27 March 1990.