- Volume 67 , Number 2
- Page: 143–9
Lot quality assurance sampling (LQAS) for monitoring a leprosy elimination program
ABSTRACT
In a statistical sense, prevalences of leprosy in different geographical areas can be called very low or rare. Conventional survey methods to monitor leprosy control programs, therefore, need large sample sizes, are expensive, and are time-consuming. Further, with the lowering of prevalence to the near-desired target level, 1 case per 10,000 population at national or subnational levels, the program administrator's concern will be shifted to smaller areas, e.g., districts, for assessment and, if needed, for necessary interventions. In this paper, Lot Quality Assurance Sampling (LQAS), a quality control tool in industry, is proposed to identify districts/regions having a prevalence of leprosy at or above a certain target level, e.g., 1 in 10,000. This technique can also be considered for identifying districts/regions at or below the target level of 1 per 10,000, i.e., areas where the elimination level is attained. For simulating various situations and strategies, a hypothetical computerized population of 10 million persons was created. This population mimics the actual population in terms of the empirical information on rural/urban distributions and the distribution of households by size for the state of Tamil Nadu, India. Various levels with respect to leprosy prevalence are created using this population. The distribution of the number of cases in the population was expected to follow the Poisson process, and this was also confirmed by examination. Sample sizes and corresponding critical values were computed using Poisson approximation. Initially, villages/towns are selected f rom the population and f rom each selected village/town households are selected using systematic sampling. Households instead of individuals are used as sampling units. This sampling procedure was simulated 1000 times in the computer f rom the base population. The results in four different prevalence situations meet the required limits of Type I error of 5% and 90% Power. It is concluded that after validation under field conditions, this method can be considered for a rapid assessment of the leprosy situation.RÉSUMÉ
Du point de vue statistique, la prévalence de la lèpre dans certaines régions géographiques peut être qualifée de très basse, voire rare. Les méthodes conventionnelles d'épidémiosurveillance dans le cadre des programmes du contrôle de la lèpre doivent alors comporter des échantillonnages importants, et sont coûteuses en temps et en argent. De plus, avec la diminution de la prévalence à des niveaux proches de l'objectif à atteindre, défini à 1 cas pour 10 000 habitants à l'échelle nationale ou sous-nationale, les préoccupations du responsable du programme vont se tourner vers des zones plus petites comme par example des districts, pour l'évaluation et, si nécessaire, les mesures d'intervention. Dans cet article, il est proposé d'utiliser l'Echantillonnage d'un Lot pour L'Asssurance de Qualité (ELAQ), un outils pour le contrôle de qualité dans l'industrie, pour identifier les districts/régions ayant une prévalence de lèpre autour ou au dessus d'un niveau cible de I pour 10 000. Cette technique peut aussi être envisagée pour identifier des districts ou des régions ayant atteint, ou étant en dessous de l'objectif de 1 pour 10 000, c'est à dire où le niveau d'élimination est atteint. Pour simuler les diverses situations et stratégies, une population virtuelle de 10 millions d'habitants a été créé par ordinateur. Cette population respecte la population réelle en terme des données empiriques concernant les distributions urbaines et rurales et la distribution des foyers d'habitation par taille pour l'état de Tamil Nadu en Inde. Des niveaux variables de prévalence de lèpre sont alors créés en utilisant cette population. I1 fut anticipé que la distribution du nombre de cas dans la population suivrait une distribution de Poisson, et cela fut confirmé par l'examen direct de celle-ci. Les tailles des échantillons et les valeurs critiques correspondantes furent calculées en utilisant les approximations de Poisson. Initialement, les villages et les villes sont sélectionnés à partir de la population considérée, puis, dans chaque village/ville sont sélectionnés des foyers d'habitation en utilisant l'échantillonage systématique. Cette procédure de prélèvements fut simulée 1000 fois par l'ordinateur à partir de la population de référence. Les résultats, pour 4 situations différentes de prévalence, étaient à chaque fois situés dans les limites requises d'une erreur de type I de 5% et d'une puissance statistique de 90%. En conclusion, sous réserve de validation dans les conditions du terrain, cette méthode devrait être considérée pour l'évaluation rapide de la situation épidémiologique de la lèpre.RESUMEN
Desde el punto de vista estadístico, la prevalência de la lepra en diferentes áreas geográficas puede considerarse como muy haja, o rara. Los métodos convencionales de exploración para supervisar los programas de control de la enfermedad necesitan, por lo tanto, de muestras de gran tamano, son caros y consumen mucho tiempo. Además, una vez que se logre el abatimiento de la prevalência de la enfermedad a valores cercanos al ideal de 1 caso por 10,000 habitantes a nivel nacional o sub-nacional, la preocupación de los administradores dei programa deberá ser la atención de áreas más pequenas, distritos, por ejempio, para su evaluación y, en su caso, para su intervención. En este trabajo se propone un método de muestreo de control de calidad industrial para identificar aquellos distritos o regiones que tienen una prevalência de lepra al nivel idóneo de 1/10,000 o superior. Esta técnica puede usarse también para identificar distritos o regiones con prevalências menores de 1 por 10,000, es decir, áreas donde se ha alcanzado el nivel de eliminación de la lepra. Para simular varias situaciones y estrategias, se creó una población hipotética computarizada de 10 millones de personas. Esta población semeja a la población actual dei estado de Tamil Nadu en la índia en cuanto a su distribución rural y urbana y en cuanto a la distribución de contactos. Con esta población se han simulado vários niveles de prevalência de la lepra. e supuso que la distribución dei número de casos en la población tuvo una distribución de Poisson, y esto se confirmo en el examen. El tamano de las muestras y los valores críticos correspondientes de calcularon usando la aproximación de Poisson. Inicialmente, las ciudades y los pueblos se seleccionaron a partir de la población, y de cada ciudad o pueblo seleccionaron los contactos convivientes usando el muestreo sistemático. Como unidades de muestreo se usaron los contactos convivientes en lugar de los indivíduos. Este procedimiento de muestreo fue simulado 1000 veces en la computadora a partir de la población base. Los resultados de cuatro diferentes situaciones de prevalência cumplieron con los limites requeridos dei error del tipo 1 de 5% y 90%. Se concluyó que después de la validación bajo condiciones de campo, este método se podría utilizar para establecer rápidamente la situación de la lepra en cualquier région geográfica.There is a need for a systematic and standardized approach for monitoring and evaluating leprosy elimination programs (7). Further, areas with a high leprosy prevalence need to be identified and targeted for any necessary strengthening of the program. To date, the available procedures for assessment are conventional sample surveys (6). These survey methods to monitor leprosy control are expensive, time-consuming and need a great deal of manpower. They also lead to nonsampling errors. There is a need for rapid assessment procedures (RAP) for future planning and strategy, in identifying districts/subregions with high prevalence, and also in understanding trends in leprosy for program monitoring (4). Recently, several possible rapid assessment procedures were examined for their efficiency in one of the districts in Tamil Nadu, India. None of these methods was found useful (1), including school surveys, limited population coverages, projections from smear-positive cases, and projections from patients with disabilities.
In this context, the Lot Quality Assurance Sampling (LQAS) technique, which has been tried successfully for monitoring and evaluating immunization programs (2), can be explored. Details of the LQAS procedure are available elsewhere (3). The LQAS is, essentially, a quality control tool in industry. In a production process, items or goods of the same type, size or grade are grouped together to make a homogeneous lot. Several lots of such goods from the production process are formed. A simple random sample of items (n) is taken from each lot for inspection to identify the number of defectives, if any. If the number of defectives in the selected sample items is less than or equal to a preassigned critical number, called the critical value (d), then the lot is accepted. On the other hand, if the number of defectives exceeds this critical number "d" even before the completion of examination of all the sample items, the lot is rejected and further inspection of sample items becomes redundant. The critical value "d" is the "maximum allowable number of cases" determined statistically to ensure high probability that the accepted lots meet quality control standards and contain relatively less number of defectives. LQAS is a procedure based on a one-tail or onesided test, and the required sample size is smaller.
In the health field, a lot may be a cluster of villages such as a taluk or a block, a district or a group of districts (region) representing a distinct health care delivery area. For a public health worker a lot is a community that is socially and geographically distinct. LQAS is a stratified sampling procedure in which a sample is drawn from each stratum or lot. Thus, a collective estimate for the prevalence of leprosy is possible by pooling information from different lots or strata. For the purpose of quality control, LQAS can be utilized at a single lot level as well.
In this study, in the context of leprosy elimination programs, the LQAS procedure has been tried for two purposes: a) to identify areas with a higher leprosy prevalence to target them for program intensification, and b) to know whether the prevalence of leprosy in identified areas has been reduced below a certain target level.
METHODS AND RESULTS
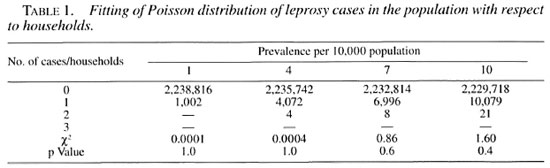
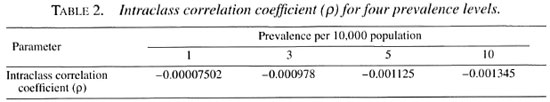
A hypothetical computerized population of 10 million people was generated, and categorized into rural and urban areas as per the 1991 census of the state of Tamil Nadu in India. The distribution of the population in households has been done using empirical information on the distribution of households by their sizes from the actual field data in Tamil Nadu. Thus, 3131 villages with an average population of 2100 and 95 towns with an average population of 35,920 were created. Each individual in the rural/urban population was identified as having the disease or not having it, according to the random probability based on the prevalence of leprosy. This exercise was done for 0.1, 1, 3, 5 and 10 per 10,000 prevalence levels. Under these conditions, the distribution of the number of leprosy cases in the population was expected to follow the Poisson process, and the same is confirmed from the data in Table 1. Accordingly, the required sample size (n) and the corresponding critical value "d" are computed for each of the four different prevalence levels. The intraclass correlation coefficient (ρ) between households, within villages/towns was estimated for four different prevalence levels. All of the p values were negative and, as expected, were close to zero (Table 2) as per the assumptions. Consequently, the design effect was less than but close to unity and, hence, there was no need to increase the sample size.
In developing countries, a complete sampling frame of individuals in the community, such as an up-to-date listing of individuals in a district, may not be readily available. In such a situation, it is pragmatic to suggest households as sampling units, consisting of an average of 4.5 individuals in our sampling frame. Selection of the households by simple random sampling is not operationally convenient and linear systematic sampling could be adopted. In this study, initially "N" villages and towns were selected from the population by probability proportional to size (PPS) linear systematic sampling, and from each selected village and town "M" households were selected by linear systematic sampling; 1000 such samples were simulated in the computer from the population for different experiments.
Situation I. In Situation I, the interest was in examining whether or not the leprosy prevalence in the population is at or above a certain threshold level so that corrective action and program intensification could be focused in those areas. LQAS was done in the computerized population of 10 million persons, considered as one lot. As an example, suppose the actual prevalence of leprosy in this lot is 10 per 10,000 and the level of 5 per 10,000 and above is considered as the threshold to intensify intervention. In this situation, the null hypothesis is stated as the prevalence in the population is at or above 5 per 10,000. The total expected number of 10,000 cases are distributed randomly in all the villages and towns of this population. A simple random sample of "n" persons is taken and examined for the disease status of the individuals. If the number of cases in the sample is more than the preassigned acceptable number, i.e., "critical value" ("d"), then it is concluded that the leprosy prevalence is at or above 5 per 10,000 population. On the other hand, if the number of cases is less than or equal to the critical value "d" in the sample, the population is regarded as having prevalence of leprosy below 5 per 10,000.
Two types of errors occur while deciding whether a given population is above or below the threshold level. Type I error occurs if the population having a higher level of leprosy prevalence is considered as being below the threshold level (and therefore accepted as a low leprosy prevalence area) when, in fact, it is not. Type I error is therefore serious and is set at or below 5%. The other error (Type II error) will occur when the sample-based estimated leprosy prevalence in the population is above the threshold level when, in fact, it is below the threshold level. A Type II error is not so serious but, for practical considerations, is usually set at or below 10%. As an extra precaution, an alternative hypothesis is chosen in such a way that the samples that would be wrongly classified as below the threshold level (Type I error) will not be substantially below the threshold (e.g., threshold 5 per 10,000 and alternative 1 per 10,000). We have followed these conventions for the purpose of this study. The alternative hypothesis is chosen in such a way that the Type II error is set at or below 10%, and this assumption is incorporated into the calculations to determine sample size (n) and the critical value "d."
The elimination target level of leprosy at the global level is below 1 per 10,000 and the same can be considered for national or regional levels. The following four experiments with possible prevalence levels nearer to this target are considered for examination and verification of the sampling technique. For Experiment I, two separate populations are used with prevalence levels at 0.1 per 10,000 and 1 per 10,000. Similarly, separate populations are used with prevalence levels at 3 and 1 per 10,000 for Experiment II; 5 and I per 10,000 for Experiment III; and 10 and 5 per 10,000 for Experiment IV. Experiment I is considered to investigate whether the prevalence in the population lies at or above 1 per 10,000 (and alternative hypothesis set at 0.1 per 10,000). Experiment II is considered to detect whether the leprosy prevalence in the population is at or above 3 per 10,000 population (with alternative hypothesis set at 1 per 10,000 population). Experiment III is to examine whether the prevalence in the population is at or above 5 per 10,000 population (and the alternative set at 1 per 10,000 population). Experiment IV is to investigate whether the prevalence in the population is at or above 10 per 10,000 population (with alternative hypothesis set at 5 per 10,000 population.)
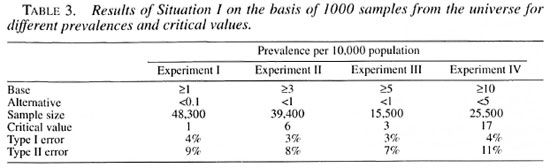
For Experiment I in Situation I assuming a Type I error (α) of 5% and Power (1-β) of 90%, the sample size "n" and the corresponding critical value "d" are chosen as the iterative solutions of two equations; one with a lower αth percentile and the other with an upper βTh percentile of the Poisson distribution as the constraints. (Interested readers may refer to Lemeshow and Taber 3.) The corresponding figures for the other three experiments are given in Table 3.
In general, one would like to have at least 30 villages/towns from the population to make the sample fairly representative of the entire population. Within each selected village/town a pre-fixed number of households are chosen. However, from the point of operational convenience and logistics of the field work, the following sample designs for the following experiments are attempted. As per the sample design given earlier in the text, Experiment I examines by considering initially 100 villages or towns from the total computerized population (lot) and 108 households are selected subsequently from each selected village/town. For Experiment II, 100 villages/towns are initially selected from the lot and 88 households are selected subsequently from each selected village/town. For Experiment III, 30 villages/towns are initially selected from the population and 115 households are selected subsequently from each selected village/town. For Experiment IV, 100 villages/towns are initially selected from the population and 57 households are selected from each selected village/town.
As an illustration: in Experiment I of Situation I, in each of the 100 selected villages the number of leprosy cases (in the sample of 108 households) is noted. The number of cases in the sample of 100 villages are then observed. If they are more than one we accept the hypothesis that the prevalence in the lot is more than 1 per 10,000. Another sample is drawn and examined for the number of cases. If it is above the critical number of one case then, again, the hypothesis is accepted; 1000 such samples are drawn and examined for the number of cases in each sample. The total number of samples that have more than one case is found to be 953, indicating the 95.3% of the samples from the lot are picked up correctly with a prevalence at or above 1 per 10,000, or only 4.7% (100%-95.3%) of the samples have one or no case. Similarly, 1000 such samples are drawn from another lot with a prevalence of 0.1 per 10,000. The number of samples having one or no case is 893, indicating that the power is 89.3% to ensure that lots having a prevalence less than or equal to 0.1 per 10,000 will not be wrongly classified as high-prevalent areas or a Type II error is only 10.7% ( I00%-89.3%). The results of 1000 simulations of the sampling exercises from the population for experiments II, III and IV show similar results as those obtained from Experiment I. These results of 1000 simulations are given in Table 3. At least 95% (96%, 97%, 97% and 96% for experiments I, II, III and IV, respectively) of the samples from the lot with prevalence at or above the threshold level are picked up correctly and a Type II error was nearly 10%, i.e., 9%, 8%, 7% and 11%, respectively, for the four experiments.
Situation II. In Situation II, our interest is in examining whether the prevalence in the lot is at or below the threshold level, i.e., whether leprosy is controlled or the elimination level is achieved. The alternative hypothesis is to examine whether the prevalence is above a certain target level. Thus, this Situation II is exactly the reverse of Situation I. Other procedures such as the household as the sampling unit, sampling design and the number of simulations of such sampling designs in the computer are similar.
Experiments la, Ila, Ilia and IVa of Situation II are exactly the same but the reverse of Experiments I, II, III and IV, respectively, for Situation I.
The sample sizes (n) required and the corresponding critical values "d" are exactly the same for the four experiments in Situation II as those in Situation I. Intraclass correlation coefficients are also the same for the four experiments since the same population frames are used. The results of 1000 simulations for the four experiments in Situation II were also in the same order of magnitude, for example, they showed that at least 95% (95%, 96%, 96% and 96% for experiments la, Ila, Ilia and IVa, respectively) of the samples from the lot with prevalence at or below the threshold level are picked up correctly and a Type II error was 11%, 11%, 8% and 11%, respectively, for the four experiments.
DISCUSSION
These experiments have shown through this computerized exercise that LQAS can be considered using the assumption of Poisson distribution and adopting the household as the sampling unit, as well as initially using PPS linear systematic sampling and subsequently using the linear systematic sampling procedure in place of a simple random sampling procedure.
If one wants to estimate the prevalence of leprosy with the precision of ±10% through a conventional sample survey by adopting a simple random sampling procedure for the four selected prevalence levels of 1, 3, 5 and 10 per 10,000 population, the required sample sizes would be 3.8, 1.3, 0.77 and 0.38 million, respectively. In comparison, the LQAS technique offers a tremendous advantage in terms of reduced sample sizes. This technique would thus provide great practical advantage for the program managers.
Some critical factors deserve attention when considering the applicability of LQAS for leprosy elimination programs. In our experiments, leprosy cases were randomly and uniformly distributed within the households in the population. The number of cases in the population follows a Poisson distribution. This may be true since leprosy is rare. However, the distribution of leprosy cases is found to be uneven. The phenomenon of Poisson and uneven distribution of leprosy cases in the population need to be critically examined before this LQAS technique can be recommended for monitoring. The near-zero intraclass correlation coefficient indicates that the distribution of leprosy in the households is similar. This implies that the risk for leprosy for household contacts and noncontacts is similar. It is known that the risk for leprosy for households contacts is higher, although possibly this risk may depend on the overall endemicity level. The assumption that the leprosy cases would follow a near-Poisson distribution in the population may be true in hyper-endemic areas. The effect of clustering and its impact can be reduced by increasing the sample size. Selection of individuals through clusters (an increase in either the number of clusters or in cluster size) will be more economical compared to selection by simple random sampling as envisaged in LQAS.
In the study for the estimation of leprosy prevalence in Bago and Kawa townships using two-stage probability proportional to the size-sampling technique, it was found that the intraclass correlation coefficient was negative (5). The LQAS technique is expected to be of particular help in initially high-endemic areas in which multidrug therapy (MDT) campaigns have been implemented for a decade or so. In such situations, the distribution of leprosy observed by us is more or less homogenous. In the highly endemic areas the risk for leprosy varies according to the contact status and geographical regions also. This differential risk is generally not perceptible at the village level (unpublished observations, Gupte, M.D., et al. ). It is expected that this marginal differential risk for leprosy may not adversely affect the proposed design. However, this hypothesis needs to be verified.
In this study, it is assumed that all the subjects in the population are clinically examined for leprosy. This will not always happen since there may be some people who are absent, temporarily migrated, seriously ill, or not willing to undergo an examination. There may be a tendency to hide if the stigma levels are high. These nonresponders will be a crucial group when drawing inferences (1). The diagnostic efficiency of the tools in terms of sensitivity and specificity also should be considered. Lowered specificity, in particular, will adversely affect the conclusions. Further work in this direction is warranted. Leprosy prevalence levels in terms of age and sex need to be considered. Examination coverages in terms of age and sex also need to be considered.
This study is based on a hypothetical computerized population which was made to mimic the real population in Tamil Nadu, India. In spite of these attempts, the population used is artificial. The present exercise, therefore, should be validated and field tested. It is possible to consider LQAS for monitoring the trend of leprosy prevalence in the community if it is carried out annually/biennially and after strengthening of the interventions. However, this possibility has not been examined by us in the present study. The main point of interest that emerges from this study is the practical utility of this technique for the program administrator or policy maker. It is a tool with which it is feasible to develop an internal monitoring mechanism for identifying highly prevalent leprosy areas, and to focus on them for intervention strategies. This technique may also help in monitoring the progress of leprosy elimination measures over a period of time and, also, ultimately could help in certifying geographical areas that achieve the suggested elimination level.
Acknowledgment. The authors are grateful to Mr. T. K. Sundarcsan and Dr. D. Daumerie for their comments and suggestions. Thanks are also due to Mr. Paul Alexius Tamby, Systems Analyst, Central Biostatistical Monitoring Unit, and Mr. K. Kanagasabai, Programming Assistant. Institute for Research in Medical Statistics, Chennai, for their help.
REFERENCES
1. Gupte, M. D., Vallishayee, R. S., Masood Ahmed, T. H., Prince, J. S., Dt: Britto, R. L. J., Rathinaraj, B., Elango, N., Balasubramanyam, S., Nagaraju, B. and Arockissamy, J. Studies on rapid assessment methods in leprosy. Indian J. Lepr. 70(1998) 165-177.
2. Lanata, C. F., Stroh, G., Jr., Black, R. E. and Gonzales, H. An evaluation of lot quality assurance sampling to monitor and improve immunization coverage. Int. J. Epidemiol. 19(1990)1086-1090.
3. Lemeshow, S. and Taber, S. Lot quality assurance sampling; single and double sampling plans. World Health Stat. Q. 44 (1991)115-132.
4. Mittal. B. N. The National Leprosy Eradication Programme in India. World Health Stat. Q. 44(1991)23-29.
5. Myint, T., Htoon, M. T. and Shwe, T. Estimation of leprosy prevalence in Bago and Kawa Townships using two-stage probability proportional to size sampling technique. Int. J. Epidemiol. 21(1992)778-783.
6. Sundaresan, T. K. Issues involved in the rapid assessment of the leprosy problem. Lepr. Rev. 63Suppl.(1992)115-205.
7. World Health Organization. Report of the second meeting of the Leprosy Elimination Advisory Group (LEAG), 10 October 1996, New Delhi, India. Annexe II. Geneva: World Health Organization, 1996.
1. Ph.D., Institute for Research in Medical Statistics,Chelput, Chennai 600 003, Tamil Nadu. India.
2. Ph.D., Institute for Research in Medical Statistics,Chelput, Chennai 600 003, Tamil Nadu. India.
Received for publication on 22 September 1998.
Accepted for publication in revised form on 17 March 1999.