- Volume 68 , Number 4
- Page: 464–73
Estimating hidden prevalence in hansen's disease through diagnosis delay and grade of disability at time of diagnosis
ABSTRACT
The objective of the present study was to propose a new method for the calculation of estimated hidden prevalence (EHP) in Hansen's disease (HD). We analyzed the records of 4142 HD patients diagnosed in the state of Rio Grande do Sul, Brazil, between 1970 and 1991. Out of these 4142 cases, 3291 patients had their grade of disability (GD) evaluated at the time of diagnosis and provided information about the time elapsed between the appearance of the symptoms and the moment when HD was identified by a physician (diagnosis delay, DD). Mean DD for the sample (in years) was 1.51 for disability grade 0, 2.14 for grade 1,4.46 for grade 2, and 9.64 for grade 2. EHP was calculated taking into account only two strata of GD using the formula HP = [(NC-GD 0/1) × 2.0 + (CN-GD 2/3) × 5.0]/(CGE × PCP), where: NC-GD 0/1 = mean annual number of newly detected grades 0 or 1 cases; CN-GD 2/3 = mean annual number of newly detected grades 2 or 3 cases; CGE = proportion of newly detected cases with GD evaluated; PCP = proportion of the population covered by the state HD control program; 2.0 and 5.0 correspond to an approximation of the mean time in years of DD in each respective stratum of GD. Applying this model, we found an EHP of 529 cases which translates to an excess of 0.58 cases/10,000 population. We also conducted a multivariate analysis using a logistic regression model. This analysis revealed that, in addition to DD, other variables such as clinical form, age group, sex and mode of detection were independent risk factors for the presence of disabilities. We also found two significant effect modification factors: DD versus clinical form and DD versus age group. Taking these findings into consideration, a more complex model was used to calculate the EHP with 16 strata (defined by clinical form of the disease, age group, and GD f rom 0 to 3). An EHP of 502 cases (excess of 0.55/10,000) was obtained with this more complex model. This result differs only 5% f rom that of the simplified model. Therefore, we conclude that the simplified model is indicated to estimate hidden prevalence of HD in the field.RÉSUMÉ
L'objectif de l'étude était de proposer une nouvelle méthode de calcul pour l'estimation de la prévalence cachée (EPC) dans la maladie de Hansen (MH). Nous avons analysé les dossiers de 4142 patients souffrant de MH diagostiqués dans l'état du Rio Grande do Sul, Brésil, entre 1970 et 1991. Parmi ces 4142 cas, 3291 patients eurent leur degré de handicap (DH) évalué au moment du diagnostic et donnèrent des informations sur le temps passé entre l'apparition des symptômes et le moment oû la MH fut identifiée par un médecin (délai de diagnostic, DD). Le DD moyen pour l'échantillon (en années) était de 1,51 pour le degré 0 de handicap, 2,14 pour le degré 1,4,46 pour le degré 2 et 9,64 pour le degré 3 de DH. L'EPC fut calculée en prenant en compte deux strates de DH et en utilisant la formule suivante: PC = [(NC-DH 0/1) × 2,0 + (CN-DH 2/3) × 5,0]/(CGE × PCP), où: NC-DH 0/1 représente le nombre moyen annuel de cas nouvellement détectés de degré de handicap 0 ou 1 ; CN-DH 2/3 = le nombre moyen annuel de nouveaux cas de DH de grade 2 ou 3; CGE = proportion de nouveaux cas détectés avec évaluation du DH; PCP est la proportion de la population couverte par de programme de contrôle public de MH; les chiffres 2,0 et 5,0 correspondent à une approximation du temps moyen en années de DD dans chaque strate de DH. En appliquant ce modèle, nous avons trouvé une EPC de 529 cas, ce qui correspond à un excès de 0,58 cas pour 10 000 habitants. Nous avons également procédé à une analyse à plusieurs variables en utilisant un modèle de régression logistique. Cette analyse a révélé que, en plus du DD, d'autres variables comme la forme clinique, le groupe d'âge, le sexe et le mode de détection étaient des facteurs indépendants de risque pour la présence d'un handicap. Nous avons aussi trouvé deux facteurs modificateurs d'effets: le DD versus la forme clinique et le DD versus le groupe d'âge. Ayant pris ces données en considération, un modèle plus complexe fut utilisé pour calculer l'EPC avec 16 strates (définies par les différentes formes cliniques de la maladie, les groupes d'âges, et les DH de 0 à 3). Une EPC de 502 cas (excès de 0,55/10 000) fut obtenue avec ce modèle plus complexe. Ce résultat ne diffère que de 5% par rapport à celui du modèle simplifié. Nous concluons donc que le modèle simplifié est celui qui est le plus indiqué pour estimer la prévalence cachée de la MH sur le terrain.RESUMEN
El objetivo del presente estúdio fue el proponer un nuevo método para el cálculo de la prevalencia oculta estimada (POE) en la enfermedad de Hansen (EH). Analizamos los expedientes de 4142 pacientes diagnosticados en el estado de Rio Grande do Sul, Brasil, entre 1970 y 1991. En 3291 pacientes se estableció el grado de discapacidad (GD) al momento del diagnóstico y los pacientes proporcionaron información sobre el tiempo de retardo en el diagnóstico, RD (tiempo transcurrido entre la aparición de sintomas y el diagnóstico de EH). El RD promedio en la muestra (en años) fue de 1.51 para el grado de discapacidad 0, 2.14 para el grado 1, 4.46 para el grado 2, y 9.64 para el grado 3. La POE se calculó tomando en cuenta sólo 2 estratos de GD usando la fórmula HP = [(NC-GD 0/1) × 2.0 + (CN-GD 2/3) × 5.0]/(CGE × PCP), donde NC-GD 0/1 = número promedio anual de casos nuevos con GD 0-1; CN-GD 2/3 = número promedio anual de casos nuevos con GD 2-3; CGE = proporción de casos nuevos detectados con evaluación de su GD; PCP = proporción de la población cubierta por el programa estatal de control de la EH; 2.0 y 5.0 corresponden a una aproximación del tiempo promedio en años de RD para cada estrato respectivo de GD. Aplicando este modelo, encontramos una POE de 529 casos, correspondientes a un exceso de 0.58 casos por una población de 10,000. También realizamos un análisis multivariado usando un modelo de regresión logística. Este análisis revelo que además del RD, otras variables, como la forma clínica, el grupo de edad, el sexo y el modo de detección, fueron factores de riesgo independientes relacionado con el desarrollo de discapacidades. También encontramos dos factores significantes modificadores de efectos. Tomando en consideración estos hallazgos, utilizamos un modelo más complejo para calcular la POE en 16 estratos (definidos por la forma clínica de la enfermedad, grupo de edad. y GD de 0 a 3). Con este modelo mâs complejo se obtuvo una POE de 502 casos (exceso de 0.55/10,000). Este resultado diliere únicamente en 5% del obtenido con el modelo simplificado. Por lo tanto, concluímos que el modelo simplificado es adecuado para calcular la prevalencia oculta de la EH en estudios de campo.Hansen's disease (HD) is often characterized by few symptoms in the beginning of its evolution. As a result, it may go undiagnosed until much later when signs and symptoms become more severe and evident (2). Among these symptoms, incapacitating lesions affecting the hands, feet, and eyes have been shown by several studies to be associated with long duration of disease at the time of diagnosis (7, 21, 27).
Taking this association into account, the World Health Organization (WHO) recommends that the proportion of HD cases that are diagnosed when the patient has already developed incapacitating lesions be used as an epidemiological indicator to evaluate the delay in case detection of HD. If all cases were diagnosed early, this proportion would be equal to zero (11). This assumption is the basis for a method proposed by Gil and Lombardi to estimate hidden prevalence in HD (7), a method which is equivalent to arbitrarily considering that, on diagnosis, disease duration is 5 years for cases with any grade of disability (GD), and 0 for cases free of disability.
In addition to disease duration, other factors such as sex, age, clinical form, and method used to detect new cases have been associated with the presence of deformities. According to some studies, cases detected by passive methods (notification, voluntary presentation) are more likely to be diagnosed after the development of severe lesions in comparison to cases diagnosed by contact survey or other active methods (17, 26). However, the mode of detection may not be independent from disease duration at the time of diagnosis since passively detected cases will probably be detected later than cases detected by active methods. In turn, other relevant variables, such as sex, age, and clinical form of HD, that are not directly related to disease evolution could be independently related with the presence of deformities at time of diagnosis.
Some studies suggest that paucibacillary (PB) cases are at higher risk for developing deformities. However, these are either descriptive studies (10, 14) or may present a selection bias, since only cases confined to hospitals were analyzed (4, 5). There is no evidence of racial predisposition for the development of deformities (12, 21), and studies aimed at assessing the relationship between the presence of deformities and the occurrence of reversal reaction were not conclusive (12, 13). Most studies (9, 17, 19, 25, 27), however, have found that the probability of having disability upon diagnosis of HD increases progressively with age and is higher for males and for multibacillary (MB) cases.
The possibility of a relationship between age, form of disease, and presence of deformities raises important questions. There is strong evidence that low prevalence areas tend to have, among newly detected cases, a high proportion of both older patients and MB cases (1, 8, 15, 20). Therefore, the high proportion of new cases with deformities in these areas could be related to age and clinical form of the disease and not necessarily to late diagnosis. Consequently, there is a question about the usefulness of the proportion of new cases with deformities as an indicator of hidden prevalence, since the presence of deformities may be related to other factors such as age and form of disease.
Until now, studies aimed at identifying factors associated with deformities in HD were based solely on bivariate analyses. Thus, there is no information regarding the interaction among the different factors and how they independently contribute to the development of deformities. To answer these questions, all factors involved should be analyzed simultaneously using multivariate analyses. Therefore, the objective of the present study was: 1) to characterize the association between the presence of deformities at the time of diagnosis of HD and time elapsed between the appearance of the symptoms and the moment of the diagnosis (diagnosis delay, DD), controlling for the effects of other possible potential confounding variables such as sex, age, clinical form, mode of detection, year of diagnosis and specialty of the physician responsible by the diagnosis; and 2) to estimate the hidden prevalence of HD based on the prevalence of deformities among newly detected cases and on diagnosis delay, once diagnosis delay is confirmed as being independently associated with the presence of deformities at the time of diagnosis.
MATERIALS AND METHODS
Secondary data were employed in the present study. Information was collected from the new case notification cards filed at the Hansen's disease central registry at the Department of Health and Environment, state of Rio Grande do Sul, Brazil. This registry includes all cases identified in the state since 1933. Initially, all of the 4142 new cases detected in the state between 1 January 1970 and 30 April 1991 were included. From this initial sample the following cases were excluded: 701 cases whose GD had not been evaluated at the time of diagnosis; 139 cases with no information about the time elapsed since the appearance of signs and symptoms; and 11 cases of ignored age. Therefore, 851 patients were excluded, and the final sample was composed of 3291 cases. The following information, referring to the time of diagnosis, was collected from the clinical records of each case: GD, DD, sex, age (in months), mode of detection, date of the diagnosis (year and month), and specialty of physician responsible for the diagnosis (dermatologist and leprologist versus generalist or other specialist). Information regarding four additional variables-classification of skin lesions based on the clinical description found in the notification cards following the Madrid criteria (23); bacteriological status; histopathological diagnosis; and result of lepromin test- was collected. The following algorithm was applied using these variables in order to categorize cases as MB or PB. We attributed a score +1 for each of the following: clinical description suggestive of MB, histopathological diagnosis suggestive of MB, bactériologie positivity, and a negative lepromin test. We attributed a score of -1 for each of the following: clinical description suggestive of PB. histopathological diagnosis suggestive of PB, bactériologie negativity, and a positive lepromin test. A score of 0 was attributed to any variable when it was inconclusive or not available. Cases were classified as MB when the sum was positive, as PB when this sum was negative, and as not classifiable (NC) when this sum was equal to 0. After being codified, the data were transcribed into a computer file using the EPI-INFO program (Centers for Disease Control and Prevention, Atlanta, Georgia, U.S.A., version 6.02).
Cases were classified by GD following the WHO criteria from 1970 (16). GD values of 0, 1, 2, and 3 were attributed to each case, according to the maximum grade observed in each evaluated segment (hands, feet and eyes). Patients with disability grades 2 or 3 at the time of diagnosis were considered as cases with deformities.
The calculation of DD (in months) was based solely on the information that had been given by the patient or, in about 5% of the cases, when the patient was a child or had mental problems, by a representative in charge of the patient. Patients diagnosed by active methods but who had not perceived any lesions in themselves were considered as having DD equal to 0. Multivariate analyses including DD and the other potential confounding factors for having deformities at the time of diagnosis were performed using the Statistical Package for the Social Sciences (SPSS, version 6).
The estimated hidden prevalence (EHP), following confirmation of DD as an independent factor associated with deformities at time of diagnosis, was calculated using the following expression:
EHP = [Σ (NCg × MDg)] / (CGE × PCP), where NCg = mean annual number of newly detected cases in each category of disability; MDg = mean time, in years, of diagnosis delay in each respective category of GD; CGE = proportion of newly detected cases with evaluation of grade of disability; PCP = proportion of the population covered by the HD control program. The denominator (CGE × PCP) takes into consideration the fact that the proportion of new cases that have their GD evaluated at the time of diagnosis is usually lower than 100%, and that control and prevention efforts usually do not cover 100% of the population. We followed the Brazilian Health Ministry guideline, which defines as covered the residents of municipalities in which there is at least one sanitary unit that develops activities aiming at the diagnosis of HD (Brasil, Ministério da Saúde. Formulário e instrumento de avaliação do Programa Nacional de Hanseníase. Brasília: Coordenação Nacional de Dermatologia Sanitária; 1993).
The calculation of the EHP according to the method described above was based on an assumption that could be illustrated by the following example: If the mean DD among cases diagnosed as grade 1 disability is 2 years, and if during year X, in any region, 200 new cases of HD are detected, it is possible to presume that these 200 cases became ill in year X-2, and that they were diagnosed 2 years later. Following the same reasoning, it is possible to presume that there would be, in this region, an additional 200 cases who became ill in year X-1 and who will be diagnosed only in year X+1, already with grade 1 disability; and that another 200 cases who became ill during year X will be diagnosed only in year X+2, also with grade 1 disability. Therefore, hidden prevalence, which corresponds to cases with grade 1 disability who will be diagnosed in the future, could be estimated as 400 cases, that is, 200 cases/year × 2 years.
RESULTS
Among the 3291 studied cases, 688 (20.9%) had deformities at the time of diagnosis (582 or 17.7% with GD = 2 and 106 or 3.2% with GD = 3); 2603 cases (79.1%) had no deformities (1665 or 50.6% with GD = 0 and 938 or 28.5% with GD = 1). DD was 29.7 months on the average, varying from a minimum of 0 to a maximum of 375 months. Mean DD was 18.1 months (1.51 years) for cases with GD = 0; 25.8 months (2.14 years) for cases with GD = 1; 53.5 months (4.46 years) for cases with GD = 2; and 116.2 months (9.64 years) for cases with GD =3. There were 1654 male cases (50.3%) and 1637 female cases (49.7%). Cases detected by active methods (contact survey, group survey) were 638 (19.4%); cases detected by other methods were 2653 (80.6%); 2,756 cases (83.7%) had been diagnosed by dermatologists or leprologists, and 535 (16.3%) by generalists or physicians of other specialties; 1563 cases (47.5%) were detected during the period between 1970 and 1980, and 1728 (52.5%) were detected between 1981 and 1991. Age at the time of diagnosis varied from a minimum of 2.1 years to a maximum of 92.3 years; the median value was 41.2 years. Concerning clinical form, 1136 cases (34.5%) were classified as PB and 1991 (58.1%) as MB; 244 cases (7.4%) were considered as not classifiable (NC) because their clinical and laboratory findings were divergent and did not allow classification as either PB or MB.
Table 1 presents the results of the multivariate analysis by logistic regression. According to this analysis, odds of presenting deformities, adjusted for covariates, increased significantly with the increment of DD. We found also that odds increased progressively with age and decreased along the period considered for the study. The odds were also statistically significantly higher for males (OR = 1.61; p <0.001) and for MB cases (OR = 2.57 ; p <0.001). We did not observe significant differences related to mode of detection (p = 0.27) or specialty of the physician who made the diagnosis (p = 0.61). This first multivariate analysis did not consider possible interactions of the principal variable in the study (DD) with the covariates.

A second multivariate analysis using the logistic regression model and assessing interactions of DD with the covariates revealed a significant odds ratio for only two of these interactions (effect modification): DD versus age group and DD versus clinical form. Taking these findings into account, a third multivariate analysis was performed, this time disregarding interactions but dividing the data into four strata defined by age group and clinical form: younger PB patients (607 cases), older PB cases (529 cases), younger MB cases (971 cases), and older MB cases (994 cases). The median age for the study group (41 years 2 months) was used to define younger or older patients. The 244 cases considered as not classifiable were excluded from this third analysis.
Table 2 presents a summary of the results observed in the four strata analyzed. In general, for equal DDs, the odds ratio obtained for having deformities at the time of diagnosis was greater in the older MB group. Thus, in younger PB patients with a DD = 48 months or more, the odds of having deformities, in relation to patients with a DD <5 months, was 3.77. These odds were about 8 times higher (OR = 31.25) in older MB patients. This finding characterizes effect modification. In all strata, the odds ratios tended to increase as DD increased: nevertheless, in younger PB patients, statistical significance (confidence interval not including the value 1.00) was observed only in the category of DD = 48 months or more, while in older MB patients the odds ratios were significant in all categories of delay. The results obtained for the younger MB group were statistically similar to those obtained for the older PB group; these two groups presented intermediate results in relation to younger PB and older MB patients.
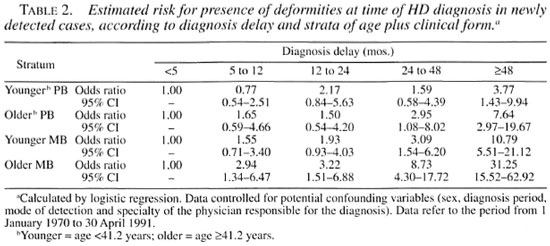
Thus, data stratification revealed that, despite the influence of the variables age group and clinical form, DD remained an independent risk factor for the presence of deformities in all strata, although with low intensity in PB cases and in younger cases. These findings justify the application of the proposed formula which uses mean DD multiplied by the mean annual number of cases in each category of GD as a key element to calculate the EHP.
In the study period, the mean annual number of new cases by GD (NCg) with the respective mean DD (MDg) was equal to 81.42 cases and 1.51 years for grade 0; 45.80 cases and 2.14 years for grade 1; 28.64 cases and 4.46 years for grade 2; and 5.44 cases and 9.64 years for grade 3. In the same period, the proportion of new cases with GD evaluated was 83.08%. The proportion of the population covered by the Rio Grande do Sul state control program, according to criteria adopted by the Brazilian Ministry of Health (Brasil, Ministério da Saúde. Formulário e instrumento de avaliação do Programa Nacional de Hanseníase. Brasília: Coordenação Nacional de Dermatologia Sanitária; 1993) was 96.60%. Applying the proposed mathematical formula to these data, we found an EHP = 499.82.
Taking into account the interactions observed in the logistic regression model, which indicated that DD has its effect modified by age and clinical form, we calculated the hidden prevalence, stratifying each category of GD by clinical form (PB and MB) and by age group (younger and older, classified according to the same criteria used in Table 2). The total number of strata, in this case, was 16. In these 16 strata, mean DD varied from 1.31 years (younger MB patients with GD = 0) to 11.62 years (older PB patients with GD = 3). The EHP based on this more complex stratification was 502.10 cases; this result is practically identical to the EHP calculated by stratifying the set of cases according to GD only.
We then performed a simplified calculation by dividing patients into only two strata: the first stratum included cases without deformities (GD = 0 or 1; NCg =127.22 cases; MDg =1.74 years); the second included cases with deformities (GD = 2 or 3; NCg = 34.08 cases; MDg = 5.18 years). The EHP obtained was 495.79.
In order to apply the simplest possible model, and considering that the information regarding DD may be biased (patients often give wrong information or round the number of years between appearance of signs and diagnosis), we repeated the calculation rounding the value of MDg (2 years for the stratum without deformity and 5 years for the stratum with deformities). The EHP based on these rounded data (which would be most useful to make quick estimations in the field) was 529.36 and, therefore, did not differ significantly from our previous results.
In 1991, the state of Rio Grande do Sul had a population of 9,135,479 inhabitants (18). A hidden prevalence of about 500 cases would correspond to a rate close to 0.5-0.6 cases/10,000 inhabitants. This value should be added to the registered prevalence in order to obtain an estimation of the real prevalence.
DISCUSSION
Some methodological aspects must be considered for a more accurate interpretation of our results. First, the fact that this study was based on secondary data must be taken into consideration. Because of that, some variables that had not been systematically collected (such as occurrence of reversal reaction episodes prior to diagnosis, patient's occupation and years of schooling) were not included in the multivariate analysis model.
Since our sample included patients diagnosed over a period of more than 20 years by over 200 physicians, it is fair to conclude that the criteria used to classify the several variables were not always homogeneous. We believe that this fact had little impact on the registration of deformities since, throughout the entire period, only the criteria established by the WHO in 1970 were used to categorize Hansen's disease-related disabilities in the state of Rio Grande do Sul. In turn, the classification of patients in terms of the clinical form of the disease (a potential confounding factor) could have been strongly affected by the use of heterogeneous criteria. To avoid this bias, we reclassified patients as PB or MB based on four items described in the patient's file (clinical presentation of the lesions, histopathology, bacilloscopy, and Mitsuda test). This ensured the homogen- ization of criteria; however, as a result, 2.9% of the cases received a PB or MB classification that was different from that originally made. In addition, 7.4% of the cases were considered as not classifiable, and thus had to be treated as a statistically distinct category.
In terms of the main independent variable in this study, diagnosis delay, it is not possible to ensure that the information obtained from the patients is accurate. It is possible only to assume that the data of a given group of patients with approximately the same disease duration at the time of diagnosis tend to be distributed around the actual value, so that the average DD informed by the patients would be close to the average of the actual delay in any stratum of the sample containing enough patients. In addition, patients usually give this information as whole, rounded numbers.
The fact that patients tend to give rounded DD values (whole numbers) led us to treat this continuous variable as a categoric variable, grouping data in quintiles. As a result, we did not calculate the average increment that would reveal the estimated risk for occurrence of deformities in each additional month of DD. Therefore, the analysis of our results was focused on two aspects: a) purely qualitative investigation of the existence (or not) of significant associations between the studied variables and the presence of deformities at the time of diagnosis; and b) employment of the odds ratios calculated using the model as tendency indicators, to investigate whether the odds for the presence of deformities increased with the increase in DD.
Regarding this last aspect, there was a consistent increase in odds associated with an increase in DD in all of the logistic regression models employed. This is in agreement with the results of other studies that employed bivariate analyses only (22, 26, 27), even though the odds ratios were not significant in all quintiles, and the intensity of the effect was not the same in all strata.
In terms of potential confounding factors, the multivariate analysis model disregarding interactions revealed a higher risk for males and for MB cases, as well as a progressively increased risk for older patients. These findings are in accordance with the findings of most previous studies employing bivariate analyses (17, 19, 22, 24, 27).
In relation to the period in which the diagnosis was made, the risk was higher for the cases diagnosed in the first years of the series. However, it is important to stress that the proportion of cases with no information regarding grade of disability (exclusion criterion), which was 34.5% in the first quintile of the series (January 1970 to August 1975) gradually declined until reaching 2.9% in the last quintile (February 1987 to April 1991). We believe that most of the cases with no information regarding grade of disability were cases without deformities, because cases with deformities are more likely to be noticed and registered. This would lead to a bias that could explain the lower risk found for cases detected later on in our series.
Since the other two potential confounding variables (detection mode and specialty of the physician in charge of the diagnosis) were of an operational character, it is unlikely that they would influence the presence of deformities in a direct and independent manner. They may, however, have had an indirect influence on diagnosis delay. The measurement of diagnosis delay is not totally objective, since it depends on the accuracy of the information given by the patient. Therefore, both the physician collecting the information and the method used to detect the case may have an influence on the accuracy of such information and, consequently, on the measured DD. This could lead to an apparent (and not actual) modification of effect. This consideration led to the inclusion of these two variables in the model. However, neither presented a statistically significant association with the presence of deformities, either in the model without interactions or in the model with interactions. In relation to mode of detection, these results are not in accordance with previous studies which found a higher risk for presence of deformities among cases diagnosed by passive methods (17, 26). These discordant findings suggest that detection mode (apparently) does not modify the effect of DD, and is not an independent risk factor for the presence of deformities. In terms of the specialty of the physician in charge of the diagnosis, there are no published data that could be compared to our results. However, the fact that there was no difference in the risk for presence of deformities among cases diagnosed by physicians of different specialties (dermatologists and leprologists versus generalists or other specialties) supports the importance of training general practitioners to diagnose Hansen's disease, as recommended by control agencies (11 and Brasil, Ministério da Saúde. Guia de controle da hanseníase. Brasília: Ministério da Saúde; 1994).
Despite the fact that age and clinical form had a modification effect on DD, all the types of stratification used to calculate hidden prevalence in the state of Rio Grande do Sul, from the most complex (16 strata, defined by GD, age, and clinical form of the disease) to the least complex (2 strata, defined by presence or not of deformities, and employing rounded DD values) produced similar results, i.e., close to 500 cases in the studied sample. These results support the validity of the simplified formula.
The use of the simplified formula is also justified, on the one hand, by the fact that the average DD was relatively similar in cases with disability grades 0 and 1 (1.51 and 2.14, respectively). This allows the two groups to be considered together without causing a substantial change in the results. In addition to that, according to the WHO recommendations (17), grades 2 and 3 patients should be grouped in one single category (and this is currently done at most institutions).
Our results are similar to those that would be obtained using the calculation method proposed by Gil and Lombardi (7). According to those authors, hidden prevalence is obtained by adding up new cases with GD >0 in the last 5 years; this number is then divided by the proportion of cases for which GD was evaluated and (optionally) by the coverage of the Hansen's disease control program. Applying this method, we found a hidden prevalence of 497.54 cases in Rio Grande do Sul. However, it is important to keep in mind that the coincidence of results using the two methods may not hold for populations in other areas, where the distribution of new cases in terms of GD is different from that of the state of Rio Grande do Sul.
It is also worth noting that the formulas proposed for the calculation of EHP can only be applied without restrictions when both the proportion of new cases with GD evaluated and the proportion of the population covered by Hansen's disease control programs are not very far from 100%, since it is not possible to ensure that the distribution of physical disabilities among the cases that were not evaluated is similar to that of evaluated cases. In addition, it is not possible to ensure that the endemic level of HD in areas not covered by control programs is similar to that of covered areas. Also, in order to use data from a specific period to calculate the annual average of new cases detected in each GD category, a large fluctuation in the detection of cases should not be present, at least in the 5 years prior to the moment of calculation. All these conditions were met in the state of Rio Grande do Sul. In the period studied (about 21 years), the mean annual coefficient of detection was 0.25 cases/10,000 inhabitants, varying from a maximum of 0.32/10,000 in 1976 to a minimum of 0.18/10,000 in 1989 (a variation of less than 30% above and below the average), with no sharp increases or decreases when considering 2 consecutive years (4, 18). The proportion of new cases with evaluated degree of disability was 0.8308 (0.9703 in the last 5 years of the study period), and the proportion of the covered population was close to 100% since the beginning of the series (6 and Brasil, Ministério da Saúde. Plano de eliminação da hanseníase no Brasil para o período 1995-2000. Brasília: Ministério da Saúde; 1994).
We should also consider that this method is not able to avoid the bias resulting from cases who died before being detected but are nevertheless part of the true incidence. Since Hansen's disease has low lethality, and since patients who die no longer constitute part of the disease's prevalence, we think that the small proportion who die before diagnosis would not have an important influence on the calculation of hidden prevalence.
It should be stressed once again that the mathematical formulas proposed in the present study to estimate hidden prevalence should not be seen as components of a precise method. Instead, they should be considered as an inexpensive way of obtaining an approximate number of undetected cases of HD for planning purposes. To validate this methodology, it would be necessary to carry out randomized population studies or, if possible in the future, infection studies employing more reliable tests to measure the endemic level of Hansen's disease in different epidemiological contexts.
CONCLUSIONS
The presence of deformities at the time of diagnosis of Hansen's disease is independently associated to diagnosis delay. Consequently, the proportion of new cases detected with deformities is an indicator of the magnitude of the hidden prevalence of this disease. Other variables, such as age, clinical form, sex, and time of diagnosis, are also associated with the presence of deformities in newly detected cases. Age and clinical form modify the effect of diagnosis delay. However, these two variables may be disregarded for the estimation of hidden prevalence since their inclusion produces results that are not substantially different from those obtained using simplified calculation methods.
For strictly operational purposes, hidden prevalence may be estimated using a simplified formula whose numerator is composed by the sum of the products obtained by multiplying the annual average of new cases with and without deformities by the respective average DDs, in years, and whose denominator corresponds to the proportion of new cases with evaluated GD multiplied by the proportion of the population that is covered by Hansen's disease control programs.
Acknowledgment. The authors thank the Graduate Research Group at Hospital de Clínicas de Porto Alegre, Brazil, for providing editorial support for the final version of this manuscript.
REFERENCES
1. Bechelli, L. M., Martinez Dominguez, V. and Patwar, K. M. WHO epidemiologic random sample surveys of leprosy in northern Nigeria (Katsina), Cameroon and Thailand (Khon Kaen). Int. J. Lepr. 34 (1966) 223-241.
2. Bechelli, L. M. and Rotberg, A. Lesões dermatológicas. In: Compêndio de Leprologia. 2nd edn. Rio de Janeiro: Ministério da Saúde, 1956.
3. Cestari, T. F., Ferreira, J. and Loureiro, R. Epidemiologia da hanseniase no Rio Grande do Sul. An. Bras. Dermatol. 64 (1989) 271-274.
4. Enna, C. D. A survey of leprous deformities in the Ryu Kyu Islands. Int. J. Lepr. 36 (1968) 271-281.
5. Faget, G. H. and Mayoral, A. Bone changes in leprosy: a clinical and roentgenologic study of 505 cases. Radiology 42 (1944) 1-13.
6. Ferreira, J., Bernardi, C. and Gerbase, A. C. Controle da hanseniase num Sistema Integrado de Atenção à Saúde. Bol. Oficina Sanit. Panam. 95 (1983) 507-514.
7. Gil, R. E. and Lombardi, C. Estimado de prevalência de lepra. Hansenol. Int. 22 (1997) 31-34.
8. Irgens, L. M. and Skjaerven, R. Secular trends in age at onset, sex ratio, and type index in leprosy observed during declining incidence rates. Am. J. Epidemiol. 122 (1985) 695-705.
9. Kushwah, S. S., Govila, A. K. and Kushwah, J. An epidemiological study of disabilities among leprosy patients attending leprosy clinic in Gwalior. Lepr. India 53 (1981) 240-247.
10. Languillon, J. Frequency and localization of plantar perforating ulcers of leprosy patients. Lepr. Rev. 35 (1964) 239-244.
11. Lechat, M. F., Misson, C. B. and Walter, J. OM-SLEP-Systéme d'enregistrement et de notification des malades de la lèpre. Genéve: Organization Mondiale de la Santé, 1981.
12. Lewis, R. and Edwards, R. A statistical study of 1000 cases of leprosy observed in Rangoon for approximately two years. Int. J. Lepr. 26 (1958) 236-251.
13. Lienhardt, C. and Fine, P. E. M. Type 1 reaction, neuritis and disability in leprosy. What is the current epidemiological situation. Lepr. Rev. 65 (1994) 9-33.
14. Mallac, M. J. Onset and pattern of deformity in leprosy. Lepr. Rev. 37 (1966) 71-91.
15. Motta, C. P. and Zuñiga, M. Time trends of Hansen's disease in Brazil. Int. J. Lepr. 58 (1990) 455-461.
16. Organización Mundial de la Salud. Epidemiologia de la lepra en relación con la lucha antileprosa. Geneve: Organizacion Mundial de la Salud, 1985. Tech. Rep. Ser. 716.
17. Pönnighaus, I. M., Boerrigter, G., Fine, P. E. M., Pönnighaus, J. M. and Russel, J. Disabilities in leprosy patients ascertained in a total survey in Karonga District, northern Malawi. Lepr. Rev. 61 (1990) 366-374.
18. Rio Grande do Sul, Secretaria da Saúde a do Meio Ambiente. A saúde pública e o meio ambiente no Rio Grande do Sul. Vol. 1. Porto Alegre: CORAG, 1993.
19. Saha, S. P. and Das, K. K. Disability pattern amongst leprosy cases in an urban area (Calcutta). Indian J. Lepr. 65 (1993) 305-314.
20. Santra, I. Epidemiological leprosy surveys in the Central provinces. Lepr. India 16 (1944) 36-40.
21. Smith, W. C. S. Epidemiology of disability in leprosy including risk factors. Lepr. Rev. 63 Suppl. (1992) 23S-30S.
22. Soshama, G. and Suryawanshi, N. Eye lesions in leprosy. Lepr. Rev. 60 (1989) 33-38.
23. Talhari, S. and Neves, R. G. Manifestações cutâneas a diagnóstico diferencial. In: Hanseníase. 2nd edn. Manaus: Instituto Superior de Estudos da Amazônia (ISEA), 1989.
24. Trindade, M. A. B., Lima, F. D. and Almeida, R. G. Incapacidades físicas em hanseníase no momento do diagnóstico. I-Avaliação das incapacidades. Hansenol. Int. 12 (1987) 21-28.
25. Trindade, M. A. B. and Nemes, M. I. B. Incapacidades físicas em hanseníase no momento do diagnóstico: características dos casos registrados de 1983 a 1988 no Estado de São Paulo. Hansenol. Int. 17 (1992) 8-14.
26. Trindade. M. A. B., Teixeira, P. R. and Paula, S. R. Incapacidades físicas em hanseníase no momento do diagnóstico. II-Indicador para avaliação do programa de controle da hanseníase. Hansenol. Int. 12 (1987) 29-37.
27. Zhang, G., Li, W., Yan, L., Yang, Z., Chen, X., Zheng, T. and Ye, G. An epidemiological survey of deformities and disabilities among 14,257 cases of leprosy in 11 counties. Lepr. Rev. 64 (1993) 143-149.
1. M.D., Ph.D.; Department of Social Medicine, Universidade Federal do Rio Grande do Sul, Brazil.
2. Ph.D.; Department of Social Medicine, Universidade Federal do Rio Grande do Sul, Brazil.
3. M.D., Ph.D.; Department of Social Medicine, Universidade Federal do Rio Grande do Sul, Brazil.
4. M.D., Ph.D., Department of Social Medicine, Universidade Federal do Rio Grande do Sul, Brazil.
Reprint requests to Dr. Ferreira, Engenheiro Alvaro Nunes Pereira, 400/303, 90570-110 Porto Alegre, RS, Brazil or FAX 55-51-316-8001; email: jferreira@hcpa.ufrgs.br
Received for publication on l May 2000.
Accepted lor publication in revised form on 7 December 2000.