- Volume 63 , Number 3
- Page: 392–5
Electrophysiological correlates of hanseniasis
ABSTRACT
Sensory nerve action potentials (SNAPs) and compound nerve action potentials (CNAPs) were recorded f rom 25 normal subjects and 21 hanseniasis patients following electrical stimulation of the median nerve at the wrist. The various nerve conduction parameters f rom the affected nerves of the patients were compared with those f rom the clinically normal nerves of patients as well as data f rom healthy individuals. Analysis of the data and clinical correlation studies indicate the suitability of amplitudes of the SNAPs and CNAPs rather than the nerve conduction velocities in better characterizing the neuropathy of the patients. Significantly reduced amplitudes of responses f rom clinically unaffected nerves of patients indicate an early stage of neuropathy, thus being of predictive value. Further, a discriminant classifier, trained on data f rom clinically affected nerves of patients, classified most of the data f rom clinically unaffected nerves of patients as abnormal. This indicates that clinical neurophysiological studies can reveal leprous neuropathy much before it becomes clinically evident by means of sensory or motor loss. A discriminant score involving only the parameters of motor threshold, amplitude of digit potential and palm nerve conduction velocity is able to classify almost all of the normal and abnormal responses. The authors hope that further confirmative studies might ultimately lead to the use of the study of distal sensory conduction in the upper limbs in possible screening of a population exposed to Mycobacterium leprae. On the other hand, misclassification of a normal person occurred and suggests that further refinement of the methods is necessary in order to facilitate wider use of the methods under field conditions.RÉSUMÉ
Les potentiels d'action nerveux sensoriels et les potentiels d'action nerveux mixtes ont été enregistrés chez 25 sujets normaux et 21 patients hanséniens après stimulation électrique du nerf médian au poignet. Les différents paramètres de la conduction nerveuse des nerfs affectés des patients ont été comparés avec ceux des nerfs cliniquement normaux des patients ainsi qu'avec les données provenant des individus en bonne santé. L'analyse des données et les études de correlation clinique indiquent que c'est l'amplitude des potentiels d'action nerveux, plutôt que la vitesse de conduction nerveuse, qui caractérise le mieux la neuropathic des patients. Des amplitudes de réponses réduites de manière significative de nerfs cliniquement non atteints chez des patients indiquent un stage précoce de neuropathic, et ont donc une valeur prédictive. De plus, une classification discriminante, réalisée à partir de données provenant de nerfs cliniquement atteints de patients, a classé comme anormaux la plupart des nerfs cliniquement indemnes des patients. Ceci indique que des études ncurophysiologiques cliniques peuvent révéler une neuropathie lépreuse longtemps avant qu'elle ne devienne évidente cliniquement suite à une perte sensorielle ou motrice. Un score discriminant comprenant seulement les paramètres de seuil moteur, l'amplitude du potentiel au doigt et la vitesse de conduction nerveuse palmaire permet de classer presque toutes les réponses normales et anormales. Les auteurs espèrent que d'autres études de confirmation pourront finalement conduire à l'utilisation de l'étude de la conduction sensorielle distale dans les membres supérieurs pour un dépistage de la population exposé au Mycobacterium leprae. D'autre part, une mauvaise classification d'une personne normale survint, ce qui suggère qu'un raffinement de la méthode est encore nécessaire afin de faciliter une utilisation plus large de la méthode dans les conditions de terrain.RESUMEN
Después de la estimulación eléctrica del nervio mediano de la muñeca se registraron los potenciales de acción nerviosa sensorial y mixta (SNAPs y CNAPs) en 25 sujetos sanos y en 21 pacientes hansenianos. Los diferentes parámetros de conducción nerviosa de los nervios afectados en los pacientes se compararon con aquellos de los nervios no afectados y con los mismos parámetros en los sujetos sanos. El análisis de los datos y los estudios de correlación clínica indican que la medición de los potenciales de acción nerviosa es un mejor parámetro que la medición de las velocidades de conducción nerviosa para establecer y caracterizar la neuropatía de los pacientes. Las respuestas de amplitud significativamente reducida en los nervios clínicamente no afectados son indicativas de una neuropatía incipiente y por lo tanto tienen valor predictive Usando esta técnica, un examinador experimentado, clasificó a la mayoría de los nervios clínicamente sanos como anormales. Esto indica que los estudios neurofisiológicos pueden revelar la neuropatía leprosa mucho antes de que esta llege a ser clínicamente evidente. Un registro discriminativo que comprenda sólo los parámetros del umbral motor, la amplitud del potencial digital, y la velocidad de condución del nervio palmar, es suficiente para clasificar a casi todas las respuestas normales y anormales. Los autores esperan que los estudios corroborativos posteriores puedan finalmente conducir al empleo de estas técnicas para establecer el nivel de conducción sensorial distal en las xtremidades superiores, en programas de exploración de las poblaciones expuestas a Mycobacterium leprae. Por otro lado, también oceurrió la clasificación errónea de una persona normal; esto indica que es necesario hacer un refinamiento de los métodos para que estos se puedan aplicar bajo condiciones de campo.Clinical neurophysiological studies significantly help in the diagnosis and assessment of various neuropathies. Hanseniasis (leprosy) primarily affects the peripheral nervous system and secondarily involves skin and certain other tissues (8). The nerves may be involved at any level, from the peripheral cutaneous nerve twigs to the dorsal root ganglia. The basis of the lesion in the peripheral nerves is the bacillus' neurotropism (2). Leprous infection entails both segmental dcmyelination and axonal degeneration (Srivivas, K. and Ramanujam, K. Hansen's disease and the neurologist. Annual Meeting of the Neurological Society of India, Vishakapatnam, 1981). Demyelinating neuropathies cause reduction in the maximum conduction velocities, and axonal polyneuropathies result in reduction of sensory or motor response amplitudes (9). Thus, in the case of leprosy, one expects reduction in the amplitude of the compound nerve action potentials (CNAP)* in addition to slowed conduction.
Reduction in motor nerve conduction velocity (NCV) (1,4,6,10,14) and changes in electromyography (EMG) (1,7,12) in leprosy have been reported by many in the literature. However, studies on sensory conduction have been few (3,5,10). Since it is known that the sensory nerves are the first to be affected in leprosy (2), it is natural to look for correlates in sensory nerve conduction parameters. Thus, it is surprising that most earlier electrophysiological studies in leprosy have concentrated on the conduction velocity in motor fibers and EMG.
The work reported here involved the study, comparison and classification of peripheral sensory nerve action potentials (SNAPs) and compound nerve action potentials (CNAPs) obtained by stimulation of the median nerves of normal individuals and leprosy patients. The purpose of the study was primarily to examine peripheral sensory nerve conduction in both clinically normal and abnormal nerves of patients in order to identify the time domain parameters which are significantly affected and to look for early electrophysiological changes in clinically normal nerves. A comprehensive approach is made in observing all relevant variables, namely sensory nerve conduction velocity (NCV), motor threshold of stimulation (S), peak-to-peak amplitudes, and the absolute and relative latencies of the dominant peaks of the CNAPs. In addition to the comparison of the mean and variance values of the various variables, it is very useful to obtain an objective measure of effectiveness for each parameter in differentiating normal from abnormal potentials. This discriminating power of different parameters was obtained by a multivariate analysis and verified by means of correlation with clinical observations.
Since all leprosy is neuropathy (2), and also because the major motivation behind this study is to look for early neurophysiological indications before the appearance of clinical symptoms, the data were deliberately not grouped as those from tuberculoid, lepromatous, or other forms of leprosy. This approach has a certain validity since there is some involvement of peripheral nerves in every clinical form of leprosy. Thus, the general significance and the common trends and extent of neuropathy could be brought out, as one can see clearly from the results of this study. Further, the authors feel that if the data were classified into different clinical groups, the sample size of each group would become too small to have any statistical significance. Thus, the results of this study must be interpreted as general evaluations of neuropathic abnormalities in leprosy, rather than that of any particular clinical form of leprosy.
MATERIALS AND METHODS
An IBM PC/XT compatible computer has been converted into a dedicated system for acquisition, analysis, and classification of evoked potentials by the addition of appropriate hardware and software. A completely programmable, two-channel, instrumentation amplifier has been designed and used to pick up the biopotentials. Employing this system, the median nerves of the subjects were stimulated pcrcutaneously at the wrist, between the tendons flexor carpi radiàlis and the palmaris longus at the distal crease. Responses were recorded from two orthodromal locations and one antidromal site. Figure 1 illustrates the locations of the stimulating and recording electrodes. Responses were recorded from a) the palmar side of third digit, b) just proximal to the elbow crease, medial to the brachial artery and c) the supraclavicular fossa over the brachial plexus at Erb's point. In addition, somatosensory evoked potentials were recorded from the contralateral cortex. The ground electrode was always positioned somewhere between the stimulus and the recording sites. The electrode-skin interface impedance was always kept below 10 Kohms. The Erb's point and the cortical potentials were acquired with the midline forehead (FZ) as reference.
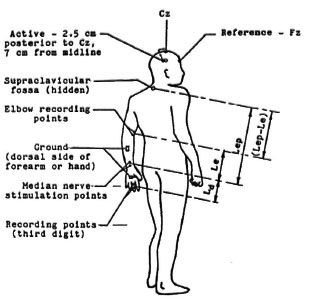
Fig 1. Stimulation and recording sites used in the study.
The study involved 25 normal subjects and 21 patients, both groups reasonably matched by age and sex. The normal subjects were drawn from a healthy population, and the patients were from the Central Leprosy Teaching and Research Institute, Chcnglepet, South India. Of the normal individuals, 23 of them were in the age group 19-31 with the mean age of 24.9 years and a mean height of 163.9 cm. None of them had a history of neurological problems. The stimulus intensity was increased from a very low value and maintained at a value to effect a minimal thumb twitch. Square wave pulses of 100 µ sec duration were applied at a rate of 1 per second to identify the stimulus strength required. The intensity and the stimulus electrode position were adjusted to effect a minimal thumb twitch at minimal voltage. The stimulus threshold having been identified, averaging was started at 2 stimuli per second. With such low voltages, repetitive stimulation at 2 per second is not painful or uncomfortable.
The recording was done with an inter-stimulus interval of 510 msec, which ensures that the supply frequency (50 Hz) noise, if present, is out of phase in successive sweeps so that it cancels itself. A filter passband of 10-3000 Hz (3 dB) was used for all the recordings. Whenever excessive artifact was present, that particular sweep of data was automatically rejected by the program. The sweep of the averaging computer was started immediately after the delivery of the stimulus with zero delay. Sixteen sweeps were averaged in the case of nerve conduction potentials at the digit and the elbow and 64 sweeps in the case of Erb's point potential. Activity was recorded for 20 msec at the rate of 16.66 KHz (samples at 60 msec equal intervals). Potentials at each point were recorded twice by performing two complete trials to ensure the correctness and repeatability of the recorded waveforms. For the normal subjects, responses were obtained only from any one of the upper extremities. The recordings from normal subjects were done in the air-conditioned laboratory where the temperature was maintained nearly constant at 27ºC.
For patient data collection, the entire evoked potential averaging system was moved to the leprosy hospital. Twenty-one inpatients were studied to investigate the extent of neurological damage. Sixteen of them were in the age group of 20-33 (mean 25.1 years, mean height 160.0 cm). Most of them had a disease history of 2 years or more (mean 5.7 years, range 1 to 15 years), and a number of them had been taking drugs recommended by the hospital for a minimum period of 1 year (mean 3.4 years, range 0.3 to 10 years). During the collection of the data from patients on various days, the room temperature varied between 29ºC and 32ºC. None of the patients studied had fever or any other health problem which affected their body temperature. Many of the patients were affected only unilaterally. However, responses were obtained from both upper extremities in order to elcctrophysiologically assess the clinically normal median nerves of the patients.
In order to explain the nomenclature used, a set of potentials recorded from a normal subject is presented in Figure 2. Here, an upright deflection indicates a negative potential and a downward deflection indicates a positive potential. By convention, the evoked potential peaks are named by their polarities and latencies. Thus, the negative brachial plexus peak which occurs around 9 to 10 msec is known usually as N9 and the following positive wave is referred to as Pl l (Fig. 2c). Although there are no such commonly accepted terms for the peripheral responses, the same convention has been used by the authors in naming these potentials. Thus, the first major negative peak in the SNAP from the third digit (Fig. 2a), whose latency was found to be around 3 msec for normal individuals, has been termed N3, "N" denoting the negative polarity of the peak and "3 " indicating the approximate latency at which it normally occurs. Similarly, the major positive peak which follows N3 in the digit response has been named as "P4," showing that the average normal latency of this peak (Fig. 2a) is around 4 msec. In an analogous manner, the major negative peak and the following positive peak in the responses from the elbow have been designated "N5" and "P6," respectively (Fig. 2b). The x axis in all of the figures (Figs. 2a to 2c) is time in msec reckoned from the instant of stimulation. The x scale is the same for all three potentials and is equal to 2 msec per division. The y axis is the absolute amplitude of the waveforms in microvolts. The nerve conduction times (NCT), as measured in this study, also have been indicated on the waveforms.
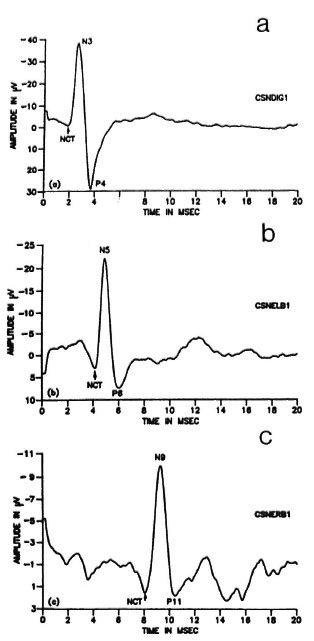
Fig. 2. Set of potentials recorded from a normal subject following median nerve stimulation at the wrist. a = SNAP from the third digit; b = CNAP from theelbow; c = EP from the Erb's point.
The patient data have been divided into two groups; one consisting of data from those upper limbs with clinical evidence of median nerve abnormality in the form of enlargement or tenderness or pain or associated muscle weakness, and the other from clinically normal upper limbs. Thus, it is possible that data from one hand of a patient was added to group(i) and that from the other hand was added to group(ii), depending upon the clinical symptoms of the individual median nerves. This distinction was made in order to observe whether there are any definite changes in the response of the nerve prior to the clinical manifestation of dysfunction.
The motor threshold of stimulation (S) was noted in each case. The neuroaverager system developed has a provision to mark a peak and the following valley, and then to read the difference in amplitude and latency. This facility enables measurement of the peak-to-peak amplitude and duration (interpeak latency between the main negative peak and the following positive peak) of a potential. The absolute latencies of the main negative peaks (N3, N5 and N9) of all three responses were read from the respective waveforms on the screen and noted. Also measured were the interpeak (relative) latencies (P4-N3, P6-N5, P11-N9) of the response peaks. Normally, the duration of the nerve action potential is measured from the initial deflection of the baseline to the intersection of the descending phase and the baseline (9). However, in this study, the difference between the latencies of the negative and positive peaks was noted, since this can be measured with better accuracy and will roughly correspond to half the duration of the potential as defined above. Further, changes in the interval between the positive and negative peaks is considered to reflect the dispersion of fast- and slow-conducting impulses (9) and, thus, could be studied for any possible differences between normal subjects and patients. In addition, the peakto-valley amplitudes of the compound nerve action potentials at the finger (Ad = P4-N3) and elbow (A e= P6-N5) were measured and tabulated. Similarly, Ab(Pl 1-N9), the peakto-pcak amplitude of the waveform recorded at Erb's point, was measured and tabulated. The nerve impulse arrival times (nerve conduction times, NCT) at the three peripheral recording sites were measured up to the initial positive deflection. The actual lengths of the nerve segments between the electrode sites were measured in each patient, and the NCVs were computed by dividing these distances by the respective segmental conduction times. In case of the arm segment, the length of the nerve involved is the difference between the distances of the two recording sites, namely, elbow and Erb's point, from the wrist. Referring to Figure 1, this segmental length can be identified as (Lep - Le). This length is divided by the corresponding segmental conduction time to arrive at the value of NCV (Va). This conduction time is the difference in arrival times of the propagating nerve impulse at the brachial plexus (NCT, arm) and elbow (NCT, forearm). The statistical significance of the deviation of patient values from the normal subjects was determined for each of the nerve conduction parameters.
Electrophysiological data were correlated to the clinical assessment of the patients. From the patient files maintained by the hospital, the clinical evaluations of the patients regarding the sensory and the motor damage in the upper limbs were recorded. Areas of partial or total loss of sensation, paresis, paralysis or anesthekinesia, locations of active and healed patches, hand clawing, if any, details regarding decompression of any nerve by surgical slitting of the nerve sheath, etc., were also noted, with a view to correlate the electrophysiological data with the clinical observations. As part of another ongoing study in the hospital, these sensory and motor evaluations of the patients were being carried out once a month and the data updated. Thus, it was worthwhile to look at the relationship between these clinical findings and the electrophysiological parameters measured.
In clinical practice, it may be very inconvenient to deal with so many different measured variables, especially when there is an overlap in the range of values for normal subjects and patients in some of the parameters. Hence, it is ideal to obtain an integrated measure or index based on these parameters, depending on the magnitude of which categorization of a nerve as normal or abnormal will be possible. Discriminant analysis is the appropriate statistical tool to use here (15) since this technique is normally used to classify an observation into one of two or more mutually exclusive and exhaustive groups on the basis of a set of predictor variables. The analysis also evaluates the effectiveness of the various parameters in distinguishing the abnormal from the normal nerve potentials. In the present study, the interest lies mainly in classifying a nerve into one of two distinct groups from the values of a set of numerical variables, namely, the measured nerve conduction variables.
The approach in discriminant analysis is as follows. After dividing the sample into two or more distinct groups, data are collected on the values of the variables for all the individuals belonging to each group. The discriminant analysis then derives a linear combination of these parameters which "best" discriminates between these groups with least error. In the case of a dichotomy, the problem is to ascertain appropriate weights for the series of variables yielding maximum linear separation in the two contrasted groups. The particular simple form of linear discriminant function allows a clear interpretation of the effect of each of the predictor variables. Thus, the main objectives in pursuing discriminant analysis in the work reported here are: a) to test whether significant differences exist between normal subjects and patients; b) to determine which variables account most for such intergroup differences; c) to find a linear combination of the predictor variables that represents the two groups by maximizing the separation between the groups and minimizing the separation within the groups; d) to establish procedures for assigning new sets of data to one of the groups, assuming that they come from one of the a priori defined groups (namely, normal individuals and leprosy patients).
If the analysis uses data on n observations to calculate the discriminant function and then classifies the same n observations, then the results will be biased. There will be more correct classifications than the discriminant function is capable of delivering under more realistic conditions. To avoid this, it is advisable to fit a function to part of the data and then to use this function to classify the remaining sets of data. Hence, of the 25 normal data collected, 18 were used to determine the discriminant function, reserving the rest to test the efficacy of the obtained classifier. To have a clear demarcation between the normal and patient data, only the data from the clinically (median nerve) affected upper limbs were employed in arriving at the discriminant function. Thus, of the 42 sets of upper limb responses from 21 patients, only 17 were included in the procedure for estimation of the coefficients of the linear discriminant function.
RESULTS
Table 1 lists the means, standard deviations and the spread of the data of the stimulus threshold and the absolute latencies of the responses for both normal subjects and patients. Some of the responses could not be recorded from three upper limbs of two patients. Hence, the data from those limbs were not included in either group for computing the statistics. It is observed that both the sensory and motor thresholds of the median nerve are appreciably higher in patients. The increase in the stimulus threshold is statistically significant (p < 0.005) in both groups of patient data. a look at the mean values of the absolute latencies reveals that it is only the distal latency n3 which is considerably prolonged in the patients (p < 0.001 in both groups). The increase in N5 is not at all significant. The changes in N9 latencies, although significant in the patient group 1 (p < 0.005), are not significant in the other group (clinically unaffected).
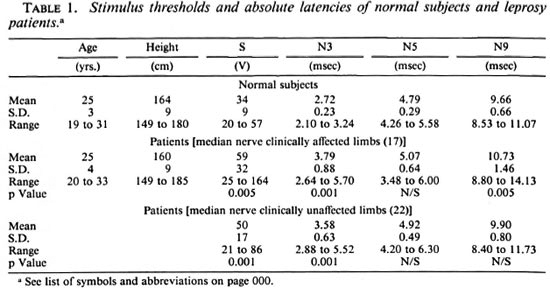
The means and variance of the fall times (interpeak latencies) of the potentials are given in Table 2. It is observed that the relative latencies of the potentials are significantly different only in the case of the digital responses (P4-N3) and that, too, only for the clinically affected nerves of the patients. There is no appreciable difference between the normal subjects and the two patient groups with respect to the mean values of the fall times of the potentials at any of the other recording sites, but the spread of values is large for the patients.
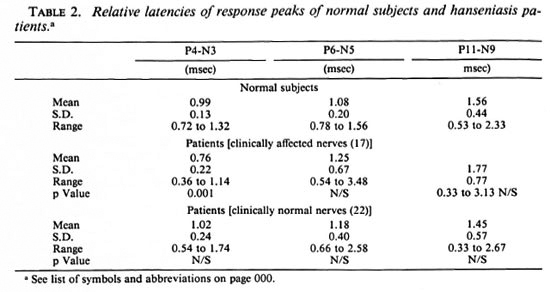
Table 3 lists the nerve condition times (NCT) and the segmental conduction velocities of the normal subjects and patients. Table 4 shows the sample statistics of the peak-to-peak amplitudes for each of thethree responses for all the three sets of data (normal subjects, clinically abnormal limbs,and clinically normal limbs) and, also, thesignificance of deviation of each group ofpatient data from normal data. It is seenthat the reduction in amplitudes of CNAPs are very highly significant, p < 0.001 at all recording locations for the clinically affected patient nerves. further, even in the case ofclinically unaffected limbs, the two distalamplitudes are significantly reduced at thesame level (p < 0.001). However, NCVs are the same level (p < 0.001). however, ncvs are reduced at this level of significance (p < 0.001) in only 3 of the 6 patient groups.
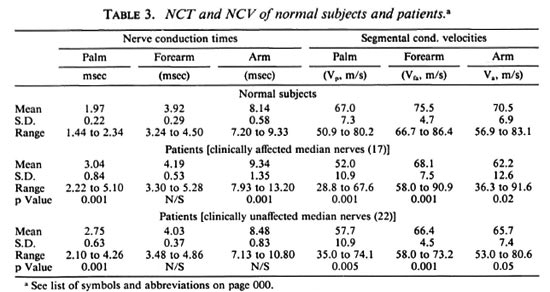
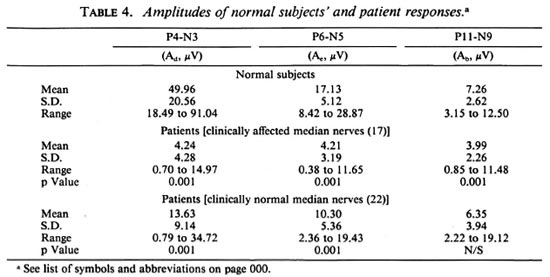
Nonetheless, there is noticeable reductionin the NCVs of all three segments for both sets of patient nerves. Even in the clinically normal set, the decrease is highly significant (p < 0.005) for the palm segmental velocity (vp), very highly significant (p < 0.001) forthe forearm segmental velocity (vfa), andsignificant (p < 0.05) for the arm segment(va). Table 4 clearly shows that the mag-nitudes of all three peripheral potentials are considerably lower in patients than in the normal subjects. The mean peak-to-peak amplitudes of the responses at the digit, elbow and Erb's point in the clinically ab-normal group are 8.5%, 24.6% and 55.0%, respectively, of the corresponding values forthe normal subjects (p < 0.001 in each case). the values for the clinically unaffected groupare 27.2% for ad and 60.1% for Ae and,again, both are very highly significant (p <0.001). these results are pictorially repre-sented in figure 3.
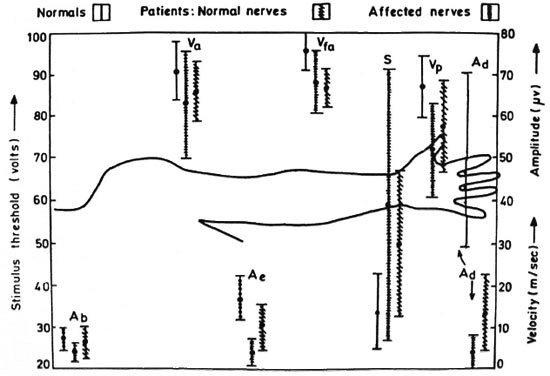
Fig. 3. Mean (±S.D.) values of nerve conduction parameters of both normal subjects and leprosy patients. Ad = digit amplitude (P4-N3); = elbow amplitude (P6-N5); Ae= Erb's amplitude (P1 l-N9); S = stimulus threshold; Vp = NCV of palm segment; Vfa = NCV of forearm; Va = NCV of arm.
The patient response waveforms have a number of small peaks spread out over time, indicating different arrival times in different nerve fibers demyelinated or otherwise damaged to different degrees. Thus, the waveshapes of all three peripheral potentials in the patients appreciably differ from those of controls.
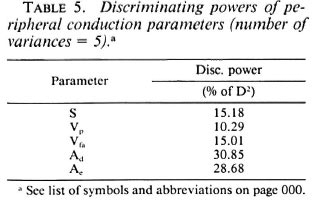
While applying the discriminant analysis to begin with, 13 parameters were considered, namely, the stimulus threshold, the four fall times, the central conduction time (which is the interpeak latency between N9 and the latency of the cortical potential), the three segmental nerve conduction velocities, and the four peak-to-peak amplitudes of the responses. The discriminant function obtained was highly effective in discriminating between the two groups. The separation between the groups is significant at the 0.05% level (p < 0.0005), denoting that the two groups are very significantly distinct. however, an inspection of the results showed that the discriminating power of five of the parameters is > 15%, while that of the others is <8%. so, a second run of the analysis was performed after eliminating the less significant variables. table 5 gives the results of the analysis using the remaining five predictor variables, namely, the stimulus strength (s), the distal velocities (vp and Vfa), and the peripheral amplitudes (Ad and Ae). Here, the discriminating power of each of the variables is given as a percentage of the Mahalanobis' generalized distance D2. Interestingly, this function with only five parameters is almost as effective (p < 0.0005) as the first classifier with 13 parameters in that it has rightly classified all of the normal subjects and the clinically affected patient limbs and, thus, the percentage of correct classification is 100 for these sets of data. the classifier classifies 38 out of the 42 responses from patients as abnormal. the point to note here is that 21 sets of responses from clinically unaffected nerves have been classified as abnormal by the classifier who has been trained only on responses from clinically abnormal nerves. only 4 of the 25 sets of data from clinically normal nerves of patients arc classified as normal, while the other 21 sets of responses from limbs with clinically confirmed involvement of only the ulnar nerve are declared abnormal with respect to the median nerve also. all five predictor variables have good discriminating power, contributing 10% to 30% to the mean separation between the groups. this result quantitatively shows that the two distal responses sufficiently identify an abnormal median nerve. in other words, the discriminating powers of the ncv in the arm segment as well as the amplitude of the erb's potential are poor compared to those of the distal potentials.
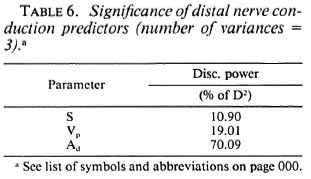
However, from the point of view of a field survey, it would be ideal if classification (as normal or abnormal) is possible based on the response obtained from a single recording site. Hence, in the final iteration, the effectiveness of a classifier involving only three parameters was studied. These are the digital response amplitude (Ad), the palm segmental conduction velocity (Vp), and the stimulus strength (S). The discriminating powers of each variable obtained in this third iteration are tabulated in Table 6. Table 7 shows the value of the discriminant function for each of the data and the resultant classification. A " b " in the table preceding the subject ID No. identifies the training data (data which were utilized to determine the discriminant function). D1 and D2 denote, respectively, the mean scores of the training data from class 1 (normal group) and class II (affected nerves of patients). D* is the critical score (obtained here as [ D1 + D2 ]/2) used to classify any unknown data into one of the above two contrasted classes. The intergroup separation based on only these variables is, again, very highly significant (p < 0.0005). the false-negative classification of the control subject n7 is due to the unusually high stimulus threshold of 57 volts.
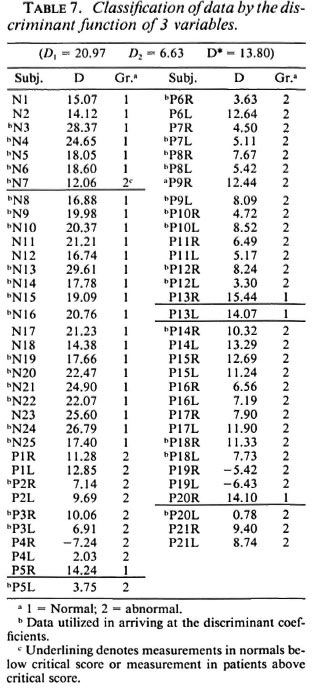
Let us consider each of the four sets of data from clinically unaffected patient limbs classified as normal. In the case of the patient P5, the stimulus threshold is very low since he is a young boy (age 15, lower than the control group). Also, his right hand is normal with normal values of NCVs (Vp = 65.3 m/sec, Vfa = 69.3 m/sec) and amplitudes (Ad = 22.0 µ V, Ae= 15.8 µ V) and with no clinical symptoms. Hence, the classification of P5-R as normal is justified. Patient P13 has been fully cured of the disease and thus is rightly classified. This patient had BT (borderline tuberculoid) leprosy, had been given dapsone (DDS) monotherapy in a local hospital, later MDT (multidrug therapy - paucibacillary) for 6 months and then was treated with 50 mg DDS - on the whole, treated for a period of 10 years. He had minimal abduction deformity in the right little finger and was operated on for surgical correction of the flexion deformity of the little finger at the metacarpophalangeal joint level. Lastly, patient P20 also has a perfectly normal right hand, both by the absence of symptoms and by the values of the various variables. Now, looking at the clinically normal data classified as abnormal, P4, for example, has ulnar nerve involvement in both hands and median nerve involvement in the right hand only. The left arm digit potential has a very low amplitude of 2.0 µ V, suggesting severe neuropathy of the left median nerve. The NCV of the distal segment (palm) also has a very low value of 35.2 m/sec. The classifier, although trained with data from clinically abnormal nerves, is able to correctly classify affected nerves such as this one which show no clinical dysfunction. This shows the efficacy of the classifier and also proves that electrophysiological studies can reveal neural abnormalities earlier than the clinical manifestation of the disease.
Thus the 3-predictor linear classifier is found to be capable of identifying properly both the normal and abnormal hands of the patients. The false-negative classification can be avoided by biasing the critical score value. This, however, may entail a few false-positive classifications and, thus, may work contrary to interest. However, 24 out of 25 normal subjects (96%) have been rightly classified, thus proving the usefulness of the discriminant function.
Clinical correlation. The clinical assessments from the patients' records were correlated with the neurophysiological data obtained. Three cases are illustrated here as examples. Patient P10 has near total loss of sensation in the distal segment up to a distance of 10 cm proximal to the wrist of both hands. Assessment of muscle power shows that the right median nerve is normal and there is lower median nerve paresis in the left hand. The fact that there is a total loss of sensation in the left hand is not reflected in the conduction velocity of the palm segment (65.3 m/scc), which is a perfectly normal value; whereas the amplitudes of the peripheral potentials are very low and the values are marginally higher in the case of the right hand (left: Ad = 1.2 µ V, A = 1.5 µ V, right: Ad = 1.3 µ V, A = 2.5 µ Vand, thus, correlate well with the clinical observations. Patient P13 has nearly been.curcd of the disease and has some residual lower ulnar motor weakness in the right hand whereas the median nerve innervated motor and sensory activities are fully normal in the left upper limb. For this patient, the right arm distal conduction velocity (54.9 m/sec) is in the abnormal range. The amplitudes of both distal peripheral potentials (Ad: 34.7, 26.9 µ V; Ae 19.4, 12.3 µV) are totally in the normal range. Considering the other case, Patient P20 has no sensations distal to the wrist in the left hand while the motor activity is normal. In the right arm, although the median nerve is thickened, there is neither sensory loss nor any motor weakness. The right arm digital response amplitude of 25.7 µV is less than the minimum normal value (mean - S.D.) of 31.5 µV and higher than the maximum in the patient range (mean + S.D.) of 18.7 µV; the value of the left arm potential is only 2.1 µV. A similar difference is seen with elbow values. On the other hand, the left arm palm NCV (58.8 m/sec), although less than the right side, is almost a normal value and gives a misleading picture if one goes by it.
DISCUSSION
Every leprosy patient suffers from peripheral nerve involvement as a result of the disease. This may vary from the involvement of intradermal nerves in a cutaneous patch to a major lesion in the nerve trunk. Thus, there is no non-neural leprosy. Despite the magnitude of the problem of leprosy incidence in the world today and the fact that about 20% of the patients suffer from major sensory and motor neurological deficits, extensive electrophysiological studies in leprosy have been few. Further, relatively more work has been done on motor conduction than on sensory conduction. Since sensory loss precedes motor deficit in almost all the patients, with the idea of early detection in mind, only sensory conduction studies have been performed in this study. These data were correlated with the clinical data of the patients. The principal time domain variables that demarcate the healthy responses from the pathological ones have been extracted by subjecting the data to discriminant analysis.
It is observed that in most of the Hansen's disease patients, the ulnar nerve is the first to be affected. Because of fear, shame and social stigma associated with this disease, few people come to leprosy centers in the early stages of the disease. Thus, even in the outpatient departments, almost all the patients reporting have advanced ulnar nerve involvement. This observation of a higher percentage and/or degree of involvement of the ulnar nerves is in general agreement with the findings of earlier researchers (1,10,13,16). The chief purpose of the work reported here has been to study the early changes in the affected nerves. So, the ulnar nerve could not be considered because, as explained above, it was difficult to get patients with minimal involvement of ulnar nerves. Thus, the median nerve was selected for study in the patients. This was done to find out the changes occurring early during the infection of the median nerve. Most of the patients chosen had little or no clinical involvement of the median nerve in at least one side.
Unlike the amplitudes and the NCVs, the changes in the absolute and relative latencies of the peaks in the various responses are not statistically significant, except for the palm segment. Thus, the latencies are not very useful in reflecting the abnormalities of patient responses. Trying to relate the nerve conduction velocities with the clinical findings has not revealed any significant correlation; whereas there is nearly perfect correlation between the amplitudes of the compound nerve action potentials and the motor or sensory deficits observed clinically. There is an appreciable reduction in the mean value of the sensory NCVs of the two distal segments (forearm and palm) although correlation with the clinical symptoms could not always be established. The normal range of palm NCV is 59.7 m/sec to 74.3 m/sec. The ranges of patient values are 41.1 m/sec to 62.9 m/sec for the clinically affected group and 46.8 m/sec to 68.6 m/sec for the other group. Thus there is an overlap in the ranges and, hence, discrimination based upon NCV alone cannot be error-free, although the reduction in both distal NCVs is highly significant. However, in the case of the amplitudes of the digital sensory nerve action potentials, there is a clear margin of around 21 µ V and 7 µ V between the normal range and the two abnormal ranges. Again, there is a margin of around 5 µ V between the ranges of elbow amplitudes between controls and the clinically affected group. This reduction in amplitudes is in spite of the higher stimulus strengths employed due to the increased thresholds of the patients. Hence, it appears that the amplitudes of the distal peripheral potentials are more reliable indicators of leprous neuropathy than the sensory NCVs. These detailed studies revealing the relative significance of the amplitudes over the NCVs as also the confirmation by correlation with clinical features have not been reported so far and, hence, might reflect an important characteristic of leprous neuropathy. Most of the earlier research has tried to relate EMG and motor NCV and, rarely, sensory NCV with the clinical dysfunction. Thus, a potentially useful fact has probably been missed. It seems that the electrodiagnostic application of NCVs in leprous neuritis should be limited to the relatively advanced cases.
The overall reduction consistently seen in the amplitudes of the peripheral potentials implies a considerable reduction in the number of active, fast-conducting sensory nerve fibers. The significance values as well as the ranges of the parameters as shown in Figure 3 underline the importance of the changes in the two distal potentials, even in the clinically normal group.
The discriminant analysis confirms that the nerve action potentials recorded from the median nerve at the elbow and third digit show discernablc abnormalities much earlier to the clinical manifestation in the form of sensory or motor deficit. The results clearly show that a classifier with only three variables is fully capable of distinguishing between the normal and abnormal median nerve responses. This discriminant function is given by,
D = -0.063S + 0.1817Vp + 0.2081Ad
where S is the motor threshold of stimulation, Vp is the NCV of the palm segment, and Ad is the amplitude of the digit potential.
The functional derangement of nerves is revealed by nerve conduction studies before the appearance of clinical signs. The reduction in the amplitude of responses in clinically unaffected nerves may indicate an early stage of nerve involvement, thus being of some predictive value. With this finding, therapy can be directed to the nerve early enough to prevent possible development of any disability. After further confirmative investigations, the study of distal conduction of the upper limbs may possibly be used to screen a population exposed to Mycobacterium leprae. However, one is not sure whether similar observations would be made in the case of ulnar nerves. Thus, it would be very informative if the studies of the above nature were carried out on ulnar nerves of patients in the early stages of leprosy. If such studies also show similar results in ulnar nerves then, in a field situation for a preliminary screening of the exposed population, it might suffice to take only the digit response to the median or ulnar nerve stimulation at the wrist and to note the stimulus threshold. If there is an order of magnitude difference between the left and right side, or if any of the values is much below the normal range, then such cases can be referred to the leprosy centers for smear tests, biopsy, etc., to establish the presence or absence of infection by M. leprae. The score of the discriminant function may also be used as the deciding factor. A quick decision can be made and the whole testing and estimating procedure may take only 15 min.
Such a quantitative electrophysiological assessment of sensory nerves could possibly become a tool for diagnosis as well as for monitoring both the progress of the disease and the effects of treatment. It could also perhaps be used to help evaluate and compare the various methods of treatment. However, the occurrence of one false-negative classification indicates that further improvement of the performance of the classifier is perhaps required to pave the way for wider use of this method under field conditions. The authors hope that by incorporating these methods for clinical evaluation of the suspected population it may eventually be possible to diagnose the neuropathy earlier than hitherto possible, leading to better management and ultimate control of the disease.
It is significant that impairment of NCV was not always found even with patients having symptoms of neural involvement. In other neuropathies, neurologists normally rely more upon NCV than amplitudes, since variabilities in amplitudes could be caused by factors not physiological in nature. But, in the case of hanseniasis, since the mean peripheral SNAP amplitudes are reduced by a factor of 10 and the elbow CNAP amplitudes by a factor of more than 4, it may be preferable to use the neural response amplitudes rather than the NCVs for clinical evaluation.
Acknowledgment. The work reported here w as completed when the authors were with the Indian Institute of Technology, Madras. The authors thank the Department of Electronics, Government of India, for providing part of the funds for carrying out these studies. The authors gratefully acknowledge the help of Dr. K. S. Rao, former Deputy Director of the Central Leprosy Teaching and Research Institute (CLTRI), Chenglepet, South India, for providing access to the patients and their functional assessment data, and Mr. Anand Satyadoss, physiotherapist, CLTRI, for his help. Thanks are also due to Dr. S. S. K. Ayyar, Consultant Neurologist, Vijaya Hospital, Madras, for his suggestions. Finally, the authors are grateful to the reviewers fortheir constructive comments.
REFERENCES
1. Antia, N. H., Pandya, S. S. and Dastur, D. K. Nerves in the arm in leprosy. 1. Clinical, electrodiagnostic and operative aspects. Int. J. Lepr. 38(1970) 12-29.
2. Charosky, C. B., Gatti, J. C. and Cardama, J. E. Neuropathies in Hansen's disease. (Editorial) Int. J. Lepr. 51(1983)576-586.
3. Dash, M. S. A study of the conduction velocity of sensory fibers of the ulnar nerve in leprosy. Int. J. Lepr. 35(1968)460-469.
4. Dhand, U. K.., Kumar, B., Dhand, R., Chopra, J. S. and Kaur, S. Phrenic nerve conduction in leprosy. Int. J. Lepr. 56(1988)389-393.
5. Gourie-Devi, M. Greater auricular nerve conduction in leprosy. Indian J. Lepr. 56(1984)182-190.
6. Hackett, E. R., Shipley, D. E. and Livengood, R. Motor nerve conduction velocity studies of the ulnar nerve in patients with leprosy. Int. J. Lepr. 36(1968)282-287.
7. Haridasan, G., Sanghvi, S. H., Joshi, V. M., Pandya, S. S. and Desai, A. D. Quantitative electromyography using automatic analysis. J. Neurol. Sci. 48(1980)353-365.
8. Jopling, W. H. Handbook of Leprosy. 3rd edn. London: William Heinemann Medical Books Ltd., 1984, p. 1.
9. Kimura, J. Elcctrodiagnosis in Diseases of Nerxe and Muscle: Principles and Practice. Philadelphia: F. A. Davis, 1983, pp. 74-76.
10. McLeod, J. G., Hargrave, J. C, Walsh, J. C, Booth, G. C, Gye, R. S. and Barron, S. A. Nerve conduction studies in leprosy. Int. J. Lepr. 43(1975)21-31.
11. Ramakrishnan, A. G. Event related potential monitoring and analysis in health and disease, Ph.D. dissertation, I. I. T., Madras, India, 1989.
12. Sebille, A. and Gray, F. Electromyographic recording and muscle biopsy in lepromatous leprosy. J. Neurol. Sci. 40(1979)3-10.
13. Sohi, A. S., Kandhari, K. C. and Singh, N. Motor nerve conduction studies in leprosy. Int. J. Dermatol. 10(1971)151-155.
14. Swift, T. R., Hackett, E. R., Shipley, D. E. and Miner, K. M. The peroneal and tibial nerves in lepromatous leprosy; clinical and electrophysiologic observations. Int. J. Lepr. 41(1973)25-34.
15. Tabachnick, B. C. and Fidell, L. S. Using Multivariate Statistics. New York: Harper & Row, 1983, p. 9.
16. Verghese, M., Ittimani, K. V., Satyanarayan, K. R., Mathai, R. and Bhakthaviziam, C. A study of the conduction velocity of the motor fibers of ulnar and median nerves in leprosy. Int. J. Lepr. 38(1970)271-277.
1. Ph.D., Assistant Professor, Department of Electrical Engineering, Indian Institute of Science, Bangalore 560012, India.
2. Ph.D., Gladys McGarey Foundation, Scottsdale, Arizona 85252-3421, U.S.A.
Received for publication on 7 March 1994
Accepted for publication in revised form on 2 June 1995.
* List of symbols and abbreviations: SNAP = sensory nerve action potential; CNAP - compound nerve action potential; EMG = electromyography; NCV = nerve conduction velocity; NCT = nerve conduction time; S = motor threshold of stimulation; S.D. = standard deviation; N/S = not significant; N3 = absolute latency of first major negative peak in sensory nerve action potential recorded from the third digit; P4 = absolute latency of positive peak following first major negative peak in the SNAP recorded from the third digit; N5 = absolute latency of first major negative peak in the CNAP recorded from the elbow; P6 = absolute latency of positive peak following first major negative peak in the CNAP recorded from the elbow; N9 = absolute latency of first major negative peak in the CNAP recorded from the Erb's point; P1 1 = absolute latency of positive peak following first major negative peak in the CNAP recorded from the Erb's point; Vp = conduction velocity of palm segment of median nerve; Vfa = conduction velocity of forearm segment of median nerve; Va = conduction velocity of arm segment of median nerve; Ad = peak-to-peak amplitude of the SNAP recorded from the third digit; Ae = peak-topeak amplitude of the CNAP recorded from the elbow, medial to brachial artery; Ab = peak-to-pcak amplitude of the CNAP recorded from the Erb's point (brachial plexus); D1 = average discriminant score for class 1 (normal subjects); D2 = average discriminant score for class 2 (clinically affected nerves of patients); D* = critical score used for classifying any data into one of the groups; D2 = Mahalabobis' generalized distance between the two groups.