- Volume 62 , Number 3
- Page: 380–8
Phenotype and cytokine expression of intralesional cells in borderline leprosy
ABSTRACT
We studied the cytokine profiles and cellular compositions in the lesions of borderline lepromatous (BL) and borderline tuberculoid (BT) leprosy patients in order to ascertain the immunological distinctions between these two groups. Using a modified, reliable, noninvasive, suction-induced blister technique to sample lesions, we determined that CD4+ T cells predominated in BT lesions; whereas CD8+ T cells predominated in BL lesions. However, the numbers of CD8+ per mm2 surface area of the lesion did not differ significantly between the two patient groups. In BT lesions, the elevation in the number of CD4+ cells was paralleled by the levels of soluble interleukin-2 (IL-2) receptor and soluble CD4 in the lesions. The CD4 + :CD8+ ratio was 16:1 in BT lesions and 0.36:1 in BL lesions, although this ratio in the peripheral blood was similar in both groups. In addition, cells expressing the CD8 molecule dominated in the TCR-γδ subpopulation. The cytokine profiles in the lesions were not as distinctly different between BL and BT patients as were the cellular compositions. However, trends observed included elevated concentrations of IL-6 in BL lesions and elevated TNF-α levels in BT lesions.RÉSUMÉ
Nous avons étudié les profils de cytokines et les compositions cellulaires dans les lésions de malades borderline lépromateux (BL) et borderline tuberculoides (BT) afin de constater les differences immunologiqucs entre ces deux groupes. Utilisant une technique modifiée, fiable et non invasive de succion pour prélever les lésions, nous avons déterminé que les cellules T CD4+ prédominaient dans les lésions BT, tandis que les cellules T CD8+ prédominaient dans les lésions BL. Cependant, le nombre de CD8+ par mm 2 de surface de la lésion ne différait pas significativement entre les deux groupes de patients. Dans les lésions BT, l'élévation du nombre de cellules CD4 + était accompagnée d'une augmentation des taux de récepteurs d'interlcukine-2 solubles (IL-2) et de CD4 soluble dans les lésions. Le ratio CD4:CD8 était de 16:1 dans les lésions BT et de 0,36:1 dans les lésions BL, bien que dans le sang périphérique, ce ratio était semblable dans les deux groupes. De plus, les cellules exprimant la molécule CD8 étaient dominantes dans la sous-population TCR-γδ. Les profils de cytokines dans les lésions n'étaient pas aussi franchement différents entre les malades BL et BT que ne l'étaient les compositions cellulaires. Cependant, on a observé une tendance à l'augmentation des concentrations de IL-6 dans les lésions BL et des taux de TNF-α dans les lésions BT.RESUMEN
Se estudiaron los perfiles de citocinas y la composición celular de las lesiones de pacientes con lepra lepromatosa subpolar (BL) y lepra tuberculoide subpolar (BT) para definir las diferencias inmunológicas entre los dos grupos. Utilizando una técnica de inducción de ampollas, confiable y no invasiva, para muestrear las lesiones, se encontró que mientras que las células T CD4+ predominaron en las lesiones BT, las células CD8 + predominaron en las lesiones BL. El número de células CD8+ por mm 2 de la superficie de la lesión no difirió significativamente entre los 2 grupos de pacientes. En las lesiones BT la elevación en el número de las células CD4 + fue paralela a los niveles del receptor soluble para interleucina-2 (IL-2) y a los niveles de CD4 soluble en las lesiones. La relación CD4 + :CD8 fue de 16:1 en las lesiones BT y de 0.36:1 en las lesiones BL, aunque esta relación en sangre periférica fue similar en ambos grupos. Además, las células que expresaron la molécula CD8 predominaron en la subpoblación TCR-gamma/delta. Los perfiles de citocinas en las lesiones no fueron tan claramente diferentes entre los pacientes BL y BT como lo fueron las composiciones celulares. Sin embargo, se observaron concentraciones elevadas de IL-6 en las lesiones BL y de TNF-alfa en las lesiones BT.Leprosy is characterized by a spectrum of clinical, bacteriological and immunological parameters (20). At the tuberculoid pole of the disease, patients have a few skin lesions which contain low numbers of Mycobacterium leprae. In contrast, at the opposite lepromatous pole, patients have many skin lesions which harbor large numbers of bacilli. Immunologically, tuberculoid patients exhibit a strong cell-mediated immunity (CMI) to M. leprae; whereas lepromatous patients display T-cell anergy but are capable of producing M. leprae-specific antibodies. Between these two poles, borderline leprosy cases usually exhibit less well-defined and less stable patterns of reactivity to M. leprae.
Leprosy has been treated successfully since the introduction of multidrug therapy (MDT) by the World Health Organization(29). However, despite the success of this treatment regimen, the occurrence of some degree of debilitating inflammatory reaction in up to 50% of borderline patients remains a problem (1,18). These reactions are termed "reversal reactions" (type 1) and erythema nodosum leprosum (ENL, type 2).
As the causative bacterium, M. leprae is considered nontoxic to the host; the clinical manifestations of leprosy are a direct consequence of the host's immune response. Hence, a clearer understanding of this response in reaction-prone borderline leprosy patients is warranted. The immune reponse of the host to invading organisms consists of two components, namely, effector cells and immune factors, such as cytokines. In the skin lesions of tuberculoid leprosy, CD4+ T lymphocytes predominate; whereas in lepromatous lesions, CD8 + cells are the major subpopulation (reviewed 26 ). Functionally, the strong CMI displayed in tuberculoid patients is characterized by the M. leprae- specific in vitro proliferation of T lymphocytes, primarily CD4+ cells, in the peripheral blood (3) and in the lesions (13, reviewed in26), combined with the delayed-type hypersensitivity (DTH) reaction observed in the Mitsuda lepromin test. The lack of this specific response in lepromatous leprosy is thought to be due to the presence of CD8+ suppressor T cells (reviewed in 11). In borderline leprosy, it has been assumed that T-cell reactivity is intermediary to the two poles.
Investigations to determine the cytokine profile in leprosy skin lesions has largely concentrated on comparisons between the polar extremes of the disease. It has been demonstrated that interleukin-2 (IL-2) is produced primarily in tuberculoid lesions; IL-1, tumor necrosis factor-alpha (TNF-α) and gamma interferon (IFN-γ) are produced throughout the spectrum, although at higher levels in tuberculoid lesions; while IL-4, IL-5 and IL-10 are found primarily in lepromatous lesions (reviewed in24,26) . From these investigations it has been concluded that the cytokine profiles in borderline lesions exhibit intermediate patterns.
Although data is accumulating regarding the nature of the immunology in the lesions at the two poles of the leprosy spectrum, there is still a scarcity of information specifically pertaining to borderline lesions. This factor together with the propensity of debilitating reaction events experienced by these patients led us to delineate further the cellular and cytokine profiles in borderline lesions. Thus the specific objective of this study was to ascertain whether significant immunological differences exist between borderline tuberculoid (BT) and borderline lepromatous (BL) lesions.
MATERIALS AND METHODS
Subjects. Twenty-seven borderline multibacillary (referred to as BL) patients (10 females and 17 males, aged 15-63 years) and 34 borderline paucibacillary (referred to as BT) patients (16 females and 18 males, aged 15-48 years) were studied. All patients had received less than 6 months of standard WHO/MDT, were not undergoing a clinical reaction event, and had not received prednisolone for at least 2 months prior to entry into this study. Patients were classified according to the criteria of Ridley and Jopling (20), including skin biopsies (where possible), and treatment was decided according to the 1982 WHO guidelines (29).
Healthy laboratory controls (7 females and 5 males, aged 18-43 years) were examined for comparison.
Lepromin skin test. One-hundred µl lepromin (WHO, Geneva, Switzerland) was injected intradermally into the flexor surface of the forearm of the patients. After 28 days the diameter of the resulting induration was measured. A positive response was greater than 3 mm in diameter.
Samples. Samples were collected from the lesions of leprosy patients and from the volar surface of the forearm of controls using a modification of the suction-induced blister method described by Scollard and colleagues (9,19). Briefly, blisters were formed by the application of suction for 1.5-2.5 hr through a rubber template taped to the skin. Two hr after blisters had formed, the fluid was aspirated into an heparinized syringe using a 23-G needle. Blisters containing red blood cells were not used for further analysis. The cells in the blister fluid were counted and then harvested by centrifugation at 300 x g x 10 min. The fluid was removed and stored at - 70ºC for later determination of cytokines and soluble molecules. The cell pellet was resuspended in 500- µ l phosphate buffered saline (PBS) prior to phenotyping. Peripheral blood was collected into heparinized vacutainer tubes. Peripheral blood mononuclear cells (PMBCs) were obtained by Ficol-density centrifugation (4) and resuspended in PBS at 1 x 10⁶ cells/ml prior to phenotyping.
Phenotyping. Fifty µ l of cells were incubated with 5 µ d of a fluorocein isothyocyanate (FITC)-conjugated monoclonal antibody and 5 µ d of a phycoerythrin (PE)conjugated monoclonal antibody. The FITC-conjugated monoclonal antibodies employed included IgG1 isotype control, anti-CD3, -CD4, -CD8, -CD19, -CD45, -T-cell receptor (TCR)-αβ, -HLA-DQ (Becton Dickinson, Belgium) and -TCR-Y5 (1:5; T Cell Sciences Inc., Cambridge, Massachusetts, U.S.A.). The PE-conjugated monoclonal antibodies included IgG, and IgG2 a isotype controls, anti-CD4, -CD8, -CD 14, -CD 16, -CD56, CD23 and -HLA-DR (Becton Dickinson). The panel of monoclonal antibodies was limited due to the low cell yields obtainable from blisters. Following a 30-min incubation on ice, the cells were washed twice and resuspended in PBS.
Quantitative flow cytometry was performed using a FACScan flow cytometer (Becton Dickinson). One-thousand to 10,000 events, depending on the cell yield, were collected for each sample using the LYSIS 2 software (Becton Dickinson). For analysis of surface antigen expression, cells with a lymphocyte (CD45+CD14-) profile were gated on side scatter versus forward light scatter.
The number of cells expressing a particular surface antigen per mm2 surface area (SA) of blister was calculated as follows:
No. positive cells/mm2 SA
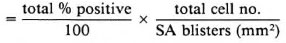
Enzyme-linked immunosorbent assays (ELISAs). The levels of IL-2, IL-4, IL-6, IFN-γ and TNF-α in the lesions of leprosy patients were determined by analyzing the blister fluid using commercially available ELISA kits (Genzyme, Boston, Massachusetts, U.S.A.).
The levels of soluble CD-4 (sCD-4), CD-8 (sCD-8) and IL-2 receptor (sIL-2R) in the blister fluid also were determined by ELISA (T Cell Sciences).
Statistical analyses. Data from each subject group were analyzed using a "between subject" t test (normal distribution) or Mann-Whitney U test.
RESULTS
Patient characteristics. The BL and the BT patient groups were similar with regard to age (BL 31.4 ± 14.7 yr; BT 24.3 ± 8.0 yr), duration of MDT at sampling (BL 3.0 ± 1.2 mo; BT 3.1 ± 1.4 mo), duration of leprosy (majority between 24 and 59 mo), and skinfold (BL 8.4 ± 2.9 mm; BT 9.8 ± 3.6 mm). The control group was similar in 5.5 mm). Skinfold measurements were performed for nutrition estimates. In the majority of BT patients tested (96%), the Mitsuda lepromin reaction was positive, while in most BL patients tested this response was negative (96%).
Blister characteristics. One to four blisters were formed in each case, with an average of 2.7 ± 1.0 blisters per individual.
Blisters were aspirated 2 hr after formation since preliminary experiments indicated this was the minimum time required for cellular infiltration. In 5 patients (3 BL and 2 BT), the total number of cells increased from 40 ± 25 cells/mm2 at 0 hr to 220 ± 54 cells/mm2 at 2 hr, and remained elevated at 48 hr after blister formation (260 ± 90 cells/mm2).
There was no specific change in the percentage of lymphocytes in the blister within 48 hr, as assessed by sequential flow cytometry analysis of individual blisters formed at the same time in the same patient in the above five patients. Specifically, at 2 hr there were 25.3 ± 6.2% CD45+CD14- cells; 24 hr, 28.1 ± 7.4% CD45 + CD14 - cells; and 48 hr, 24.6 ± 8.1% CD45 + CD14 - cells.
The volume of fluid harvested per blister was similar in all leprosy patients (BL 57.0 ± 36.6 µ l; BT 66.1 ± 38.2 µ l), although the yield in controls (91.8 ± 49.3 µ l/blister) was greater in comparison (p = 0.02 and p = 0.07, respectively). The total number of cells per mm2 of lesion or skin was variable in each group, and no significant differences existed between patient groups and the control group. However, there tended to be more cells harvested from the lesions of BL patients (249 ± 226 cells/mm2) and BT patients (301 ± 263 cells/mm2) and fewer cells from the skin of control individuals (175 ± 135 cells/mm2).
Lesion subpopulations. Figure 1 and Table 1 demonstrate the levels of cells with monocyte, T-cell, B-cell and natural killer (NK)-cell surface phenotypes that were present in the lesions of BT and BL patients and in the skin of controls as determined by flow cytometry. In BT lesions, the number of T cells (CD3 + CD16/CD56-) were significantly higher compared to BL lesions and controls. Monocytes (CD45+CD14+) per mm2 tended to be higher in BL lesions and were lowest in controls, although due to the variations within each group the differences were not statistically significant. The numbers of B cells (CD 19+) and NK cells (CD3-CD16/CD56 + ) were not significantly different between the two patient groups or between patient and control groups.
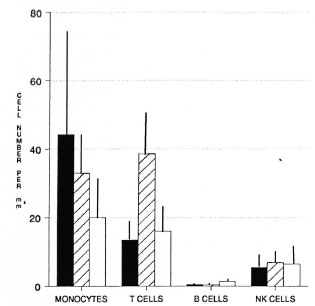
Fig. 1. Phenotypes of mononuclear cells in BT andBL lesions: cells were separated from blister fluid andanalyzed by flow cytometry. Number of cells per mm2 surface area of lesion or skin was calculated for monocytes (CD45+CD14+),Tcells (CD3+), B cells (CD I9+),and NK cells (CD3-CD16/CD56+). Mean ± S.E.M.for each patient group is shown. ■ = BL;  = BT; □= controls.
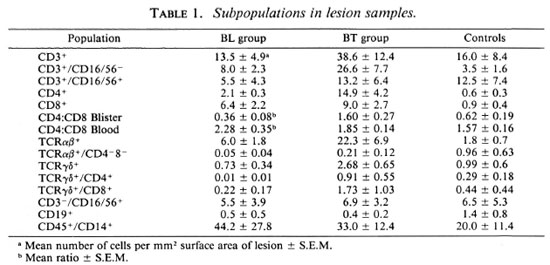
Lesion T cells. The significantly higher number of T cells per mm2 surface area in the lesions of BT compared to BL patients was predominantly due to the elevated numbers of cells with a CD4+ phenotype (Fig. 2, Table 1). The level of CD4+ T cells in lesions was 7 times higher in the BT group than in the BL group (p < 0.01). On the other hand, the number of CD8+ cells in the lesions of BT patients was not significantly different from that in BL lesions, although CD8 + cells predominated in the latter. In addition, both T cells expressing the αβ and those expressing the γδ receptor were elevated in BT lesions (p = 0.03 and p = 0.008, respectively) compared to BL lesions. In the case of TCR- γδ + cells, the majority in all groups exhibited the CD8 + phenotype. There was no significant difference between groups with regard to the numbers of CD3+CD16/56+ cells, a possible subset of cytotoxic T lymphocytes.
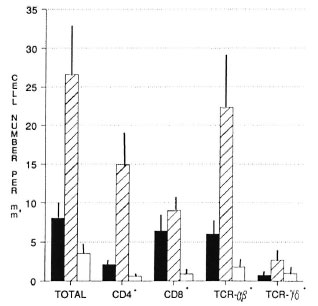
Fig. 2. Phenotypes of T lymphocytes in BT and BL. lesions: cells were separated from blister fluid andanalyzed by flow cytometry. Number of cells per mm2 surface area of lesion or skin was calculated for total T cells (CD3+CD16/CD56+), CD4+, CD8+, TCR-αβ +,and TCR- γδ cells. Mean ± S.E.M. for each patientgroup is shown. ■ = BL; = BT; □ = controls.
CD4 + :CD8+ ratio. In the lesions, the CD4+:CD8+ T-cell ratio was significantly greater in BT patients compared to BL patients and to control skin (p < 0.01) (Table 1). However, in the peripheral blood there was no significant difference in this ratio between BT patients and BL patients or between patient groups and the control group.
Soluble molecules in lesions. Soluble CD4, CD8 and IL-2 receptor levels also were determined by ELISA (Table 2). In BT lesions, sCD4 levels were twice those of BL lesions (p = 0.02); whereas sCD8 levels did not differ significantly. In addition, sIL-2R concentrations were three times higher in BT lesions (p = 0.08).
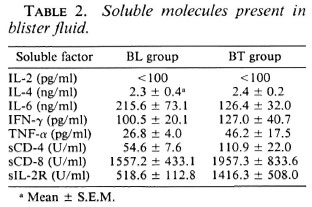
Cytokine levels in lesions. The levels of IL-2, IL-4, IL-6, IFN-γ and TNF-α in the lesions of BT and BL patients were measured by ELISA of aspirated blister fluid. IL-6 levels tended to be higher in BL lesions (p = 0.1), whereas TNF-α levels were higher in BT lesions (p = 0.1). There appeared to be no differences in the levels of IL-4 and I FN-7 between the two patient groups. IL-2 concentrations were not detectable with the ELISAs employed (Table 2).
DISCUSSION
Our findings indicate that the immunology of the leprosy lesions in BL and BT patients are significantly different, although such lesions in individual borderline patients have previously been considered to represent points along the continuum of the immunological spectrum of leprosy.
We observed a striking difference in the lymphocyte composition of lesions between the BL and BT patient groups. Our observations follow previous reports regarding the difference between the polar forms of the disease, tuberculoid (TT) and lepromatous (LL) leprosy. Specifically, we observed that CD4+ T lymphocytes predominated in BT lesions; whereas CD8+ T cells predominated in BL lesions. The ratio of CD4 + :CD8+ cells reported here for BT lesions (1.6:1) and BL lesions (0.36:1) were similar to those previously reported for polar lesions (TT = 1.9:1 and LL = 0.6:1) as determined by in situ analysis of frozen biopsy samples (reviewed in 11). It is interesting to note that the CD4 + :CD8+ ratio in the peripheral blood was independent of that found in the lesions of the BL patients examined here. Similar observations have been reported previously for polar leprosy12,28), suggesting that the cells sampled were not infiltrates from the peripheral blood and that selective migration into, proliferation within, or retention in the lesions may be occurring.
In the study presented here, we extend the above observations by the finding that the overall number of T lymphocytes per mm2 surface area of the lesion was elevated in BT compared to BL lesions and control skin. This difference was primarily a reflection of the elevated numbers of CD4 + cells. In addition, the numbers of CD8 + cells were not significantly different between the two groups. CD4+ T cells have been shown to proliferate upon exposure to M. leprae in vitro (14). Therefore, the depressed numbers of CD4+ cells in BL lesions may indicate that fewer T cells capable of responding to M. leprae are present in the lesion. This lack of responsiveness was evidenced by the inability of most BL patients to display a positive Mitsuda response. In addition, it has been reported that the majority of CD4 + T cells in lepromatous lesions have a naive phenotype; whereas the predominant cells in tuberculoid lesions have a memory phenotype (6,14) Another functional significance of the predominance of CD8 + T cells in the lesions of BL patients may be the suppressor ability reportedly exhibited by some of these cells (reviewed in 26).
Thus, from this investigation and previously reported data it appears that the cellular composition of BL lesions more closely resembles LL lesions than BT lesions and BT lesions resemble TT lesions.
In the nonreactive borderline lesions investigated in this study, the majority of CD3+ lymphocytes possessed the αβ -TCR, with only 5º/o-6% CD3+ cells expressing TCR- γδ . The majority of the TCR- γδ + cells in all groups expressed the CD8 molecule, although the ratio of TCR γδ + CD4 + : CD8+ cells in BL lesions was 1:20 compared to 1:2 in BT lesions and normal skin. It is possible that some of these TCR- γδ + CD8+ cells in BL lesions possess suppressor functions, such as previously described for TCR- αβ + cells in lepromatous lesions (12,13). TCR γδ + cells are thought to play a role in DTH reactions, as suggested by the elevation of these cell types during lepromin skin reactions and reversal reactions (15). It is, therefore, conceivable that the predominance of CD8+ TCR- γδ + cells in nonreactive lesions may maintain the suppression of DTH reactions within a given threshold level.
While cellular phenotype indicates the type of cells present in the lesion and is suggestive of immunological effectors, it does not allow the function and the activation state of these cells to be determined. In this study, nonspecific indicators of the functional capacity within the leprosy lesion included the presence of cytokines and the assessment of soluble molecules such as sIL- 2R.
We observed that the level of soluble IL-2 receptor was three times higher in BT lesions compared to BL lesions. This finding is in agreement with previous findings in which cells bearing the IL-2 receptor were relatively more abundant in lepromatous lesions (10). The elevation in the level of soluble IL-2 receptors in BT lesions also parallelled the observed elevation of CD4+ T cell numbers. Soluble IL-2 receptor is an indicator of CMI since IL-2 receptors are expressed during T-cell activation (5). In addition, soluble IL-2 receptors appear to be released from predominantly CD4+ T cells (17) during the expression of the functional receptor on the cell surface (21)- Therefore, the elevation of soluble IL-2 receptor levels in BT lesions is possibly due to the higher degree of CD4+ T-cell activation in response to M. leprae.
The level of IL-2 reported by others in the lesions of patients at the tuberculoid pole of the spectrum (3,13,30) and the reconsti- tution of T-cell immunity by intralesional administration of IL-2 (8) also suggest that IL-2 expression should be high in BT patients and low in BL patients. In our study we did not observe a parallel elevation in IL-2 concentrations. This may be due to the low levels of this cytokine present in lesions. However, it is more likely due to the low sensitivity of the assay, possibly caused by inhibitors present in the blister fluid.
The profile of cytokine production was not strikingly different between BT and BL lesions, although the trends observed suggest that IL-6 was higher in BL lesions and TNF-α was higher in BT lesions. Hence, the striking distinction observed between BT and BL lesions regarding the cellular composition may not be a true indication of the functional responsiveness in these lesions. Thus, with regard to cytokine patterns the results obtained here indicate a continuity in the borderline area of the spectrum between the leprosy poles. This observation is supported by the in situ results obtained by Arnoldi and colleagues (1).
Modlin's group (22,30) have used the pattern of cytokine production, as assessed by polymerase chain reaction (PCR) on biopsy specimens and T-cell clones obtained from lesions, to hypothesize the existence of two distinct subsets of T cells in leprosy. One subset which predominates in tuberculoid leprosy produces primarily IL-2 and IFN-γ and corresponds to the resistant murine THl phenotype. The other subset predominates in lepromatous leprosy and represents the susceptible phenotype, secreting IL-4, IL-5 and IL-10. While our results do not further extend these observations, they do question the ability to draw clear separations between the classes of leprosy based solely on cytokine production.
The levels of TNF-α are reportedly elevated in tuberculoid leprosy which is in agreement with our findings (1,27,30). However, conflicting evidence suggests that these levels may be affected by the duration of antileprosy treatment (1,23). The role of TNF-α in the pathogenesis of leprosy is thought to be due to the inflammatory properties exhibited, particularly the ability to influence macrophage cytotoxicity.
We observed that IL-6 tended to be higher in BL lesions. This finding opposes the results of PCR analysis on polar tuberculoid and lepromatous lesion samples (30) and is contrary to the expectation suggested from the elevated numbers of CD4+ T cells observed in BT lesions. One explanation may be that borderline leprosy does not adhere to the patterns observed at the poles. Alternatively, production of IL-6 by other cell types, such as fibroblasts and macrophages, may account for the elevation observed in BL lesions. More simply, it is possible that the different measurements employed to determine the presence of cytokines in leprosy lesions, mRNA in the case of Modlin's group and protein levels in this study, may account for the above discrepancy.
IFN-γ is another cytokine thought to be important in the pathogenesis of leprosy. It has been suggested that IFN-γ is responsible for the activation of macrophages to kill M. leprae in vivo (16). In this study we did not observe striking differences in IFN-γ levels between BT and BL lesions. This result is in agreement with in situ analysis of frozen biopsy specimens across the leprosy spectrum (1). These workers noted that differences existed only between the polar forms of the disease, further highlighting the continuum of cytokine patterns in borderline groups.
This study demonstrated the value of the suction-induced blister technique (reviewed in 24) for direct sampling of the local environment in leprosy lesions. Most importantly, this is the first report in which this noninvasive and nontraumatic method has been employed to determine the presence of cytokines directly in the lesions of leprosy patients. Our modifications also allowed the sampling of lesion material within half a day as opposed to more than 24 hr in the original technique (9,19). An additional advantage of the suction-induced blister method included ease in separating cells and cytokine-containing blister fluid, therefore obviating the requirement for the potentially selective enzymatic and harsh physical manipulations necessary to extract cells from biopsy material (13). Furthermore, this suction method allowed a representative sample of the cells in the lesion to be studied, as demonstrated previously (9,19,25).
Comparing our modified lesion blister sampling technique to previous reports, we found that total cell and fluid yields were similar to those obtained 24 hr after blister formation (9). However, the proportion of mononuclear cells was lower. In our case, flow cytometry was used to assess the phenotypes of cells compared to the filter and microscopy method used by others. Therefore, the sensitivity and specificity of flow cytometry enabled us to electronically select mononuclear cells and to determine the relative proportions of cells within this subpopulation. We ascertained that the percentage of lymphocytes did not change between 2 and 48 hr after blister formation. Kenney and colleagues (9) reported that the first 24 hr was characterized by a mild inflammatory response at the site of the blister. However, we did not observe this phenomenon since no influx of poly- morphonuclear or mononuclear cells was apparent. Therefore, we report a more convenient and time-saving modification to the original suction-induced blister sampling of leprosy lesions.
In conclusion, we have demonstrated that there are significant immunological differences between the lesions of borderline lepromatous and borderline tuberculoid leprosy patients, particularly regarding the cellular composition. In addition, we have collected baseline data for a group of reaction-prone borderline leprosy patients. It will be interesting to compare these cellular and cytokine profiles to those of lesions undergoing reversal reactions.
Acknowledgment. We are indebted to the staff of the Leprosy Control Unit of the All Africa Leprosy Rehabilitation and Training Centre in Ethiopia for their continued assistance regarding patient monitoring and tracing. In addition, we thank Dr. Hakan Miorner, current Director of the Armauer Hansen Research Institute, for supporting the publication of this manuscript and The Wellesley Research Institute for assisting in the preparation of this paper.
REFERENCES
1. Arnoldi, J., Gerdes, J. and Flad, H.-D. Immunohistologic assessment of cytokine production of infiltrating cells in various forms of leprosy. Am. J. Pathol. 137(1990)749-753.
2. Becx-Bluemink, M. Operational aspects of multidrug therapy. Int. J. Lepr. 57(1989)540-551.
3. Bjune, G. In vitro lymphocyte stimulation in leprosy: simultaneous stimulation with Mycobacterium leprae antigens and phytohaemagglutinin. Clin. Exp. Immunol. 36(1979)479-487.
4. Boyum, A. Separation of leukocytes from blood and bone marrow. Scand. J. Clin. Lab. Invest. 21(1968)77-79.
5. Cantrell, D. A. and Smith, K. A. Transient expression of interleukin-2 receptors: consequences for T cell growth. J. Exp. Med. 158(1983)1895- 1911.
6. Cooper, C. L., Mueller, C, Sinchaisri, T.-A., Pirmez, C, Chan, J., Kaplan, G., Young, S. M. M., Weissman, I. L., Bloom, B. R., Rea, T. H. and Modlin, R. L. Analysis of naturally occurring delayed-type hypersensitivity reactions in leprosy by in situ hybridization. J. Exp. Med. 169 (1989) 1565-1581.
7. Flad, H.-D., Arnoldi, J., Ohlert, A., Kazda, J. and Gerdes, J. Cytokine production and proliferative capacity of infiltrating cells in various forms of leprosy. Trop. Med. Parasitol. 41(1990)307-309.
8. Kaplan, G., Keissling, R., Teklemariam, S., Hancock, G., Sheftel, G., Job, C. K., Converse, P., Ottenhoff, T. H. M., Becx-Bleumink, M., Dietz, M. and Cohn, Z. A. The reconstitution of cell-mediated immunity in the cutaneous lesions of lepromatous leprosy by recombinant interleukin 2. J. Exp. Med. 169(1989)893-907.
9. Kenney, R. T., Rangdaeng, S. and Scollard, D. M. Skin blister immunocytology: a new method to quantify cellular kinetics in vivo. J. Immunol. Methods 97(1987)101-110.
10. Longley, B. J., Haregewoin, A., De Beaumont, W., Smith, K. A. and Godal, T. Lepromin stimulates interleukin-2 production and interleukin-2 receptor expression in situ in lepromatous leprosy patients. Lepr. Rev. 57 Suppl. 1(1986)189-198.
11. Mehra, V. and Modlin, R. L. T-lymphocytes in leprosy lesions. Curr. Topics Microbiol. Immunol 155(1990)97-109.
12. Modlin, R. L., Kato, H., Mehra, V., Nelson, K. E., Fan, X., Rea, T. H., Pattengale, P. K. and Bloom, B. R. Genetically restricted suppressor T-cell clones derived from lepromatous leprosy lesions. (Letter) Nature 322 (1986) 459-461.
13. Modlin, R. L., Mehra, V., Wong, L., Fujimiya, Y., Chang, W. C, Horwitz, D. A., Bloom, B. R., Rea, T. H. and Pattengale, P. K. Suppressor T lymphocytes from lepromatous leprosy skin lesions. J. Immunol. 137(1986)2831-2834.
14. Modlin, R. L., Melancon-Kaplan, J., Young, S. M. M., Pirmez, C, Kino, H., Convit, J., Rea, T. H. and Bloom, B. R. Learning from lesions: patterns of tissue inflammation in leprosy. Proc. Natl. Acad. Sci. 85(1988)1213-1217.
15. MODLIN, R. L., PIRMEZ, C, HOFMAN, F. M., TORIGIAN, V., UYEMURA, K., REA, T. H., BLOOM, B. R. and BRENNER, M. B. Lymphocytes bearing antigen-specific γδ T-cell receptors accumulate in human infectious disease lesions. Nature 339(1989)544-548.
16. Nathan, C. F., Kaplan, G., Levis, W. R., Nusrat, A., Witmer, M. D., Sherwin, S. A., Job, C. K., Horowitz, C. R., Steinman, R. M. and Cohn, Z. A. Local and systemic effects of intradermal recombinant interferon-γ in patients with lepromatous leprosy. N. Engl. J. Med. 315(1986)6-15.
17. Nelson, D. L., Rubin, L. A., Kurman, C. C, Fritz, M. E. and Boutin, B. An analysis of the cellular requirements for the production of soluble interleukin-2 receptors in vitro. J. Clin. Immunol. 6(1986)114-120.
18. Pfaltzgraff, R. E. and Bryceson, A. Clinical Leprosy. In: Leprosy. Hastings, R. C., ed. Edinburgh: Churchill Livingstone, 1985, pp. 134-176.
19. Rangdaeng, S., Scollard, D. M., Suriyanon, V., Smith, T., Thampraset, K. and Thee-Tranont, C. Studies of human leprosy lesions in situ using suction-induced blisters. 1. Cellular components of new, uncomplicated lesions. Int. J. Lepr. 57(1989)492-498.
20. Ridley, D. S. and Jopling, W. H. Classification of leprosy according to immunity; a five-group system. Int. J. Lepr. 34(1966)255-273.
21. Rubin, L. A., Kurman, C. C, Fritz, M. E., Bid-Dieson, W. E., Boutin, B., Yarchoan, R. and Nelson, D. L. Soluble interleukin-2 receptors are released from activated human lymphoid cells in vitro. J. Immunol. 135(1985)3172-3177.
22. Salgame, P., Abrams, J. S., Clayberger, C, Goldstein, H., convit, J., Modlin, R. L. and Bloom, B. R. Differing lymphokine profiles of functional subsets of human CD4 and CD8 T cell clones. Science 254(1991)279-282.
23. Sarno, E. N., Grau, G. E., Vieira, L. M. M. and Nery, J. A. Serum levels of tumour necrosis factor-alpha and interleukin-1 beta during leprosy reactional states. Clin. Exp. Immunol. 84(1991)103-108.
24. Scollard, D. M. Inside the skin: the local immune and inflammatory milieu in leprosy. Am. J. Trop. Med. Hyg. 44(1991)17-23.
25. Scollard, D. M., Suriyanon, V., Bhoopat, L., Wagner, D. K., Smith, T. C, Thamprasert, K., Nelson, D. M. and Theetranont, C. Studies of human leprosy lesions in situ using suction-induced blisters. 2. Cell changes and soluble interleukin 2 receptor (Tac peptide) in reversal reactions. Int. J. Lepr. 58(1990)469-479.
26. SIELING, P. A. and MODLING, R. L. T cell and cytokine patterns in leprosy skin lesions. Springer Semin. Immunopathol. 13(1992)413-426.
27. SILVA, C. L. and Foss, N. T. Tumor necrosis factor in leprosy patients. J. Infect. Dis. 159(1989)787-790.
28. Van Voorhis, W. C, Kaplan, G., Sarno, E. N., Horowitz, M. A., Steinman, R. M., Levis, W. R., Nogueira, N., Hair, L. S., Gattass, C. R., Arrick, B. A. and Cohen, Z. A. The cutaneous infiltrates of leprosy; cellular characteristics and the predominant T-cell phenotypes. N. Engl. J. Med. 307(1982)1593-1597.
29. Who Study Group. Chemotherapy of leprosy for control programmes. Geneva: World Health Organization, 1982. Tech. Rep. Ser. 675.
30. Yamamura, M., Yuemura, K., Deans, R. J., Weinberg, K., Rea, T. H., Bloom, B. R. and Modlin, R. L. Defining protective responses to pathogens: cytokine profiles in leprosy lesions. Science 254(1991)277-279.
1. Ph.D.; Armauer Hansen Research Institute, Addis Ababa, Ethiopia.
2. R.N., Leprosy Control Unit, All Africa Leprosy Rehabilitation and Training Center, Addis Ababa, Ethiopia.
3. Ph.D.; Armauer Hansen Research Institute, Addis Ababa, Ethiopia.
4. B.Sc; Armauer Hansen Research Institute, Addis Ababa, Ethiopia.
5. R.N., Armauer Hansen Research Institute, Addis Ababa, Ethiopia.
Address correspondence to: K. McClean, Ph.D., Suite 704, 10 Rowena Drive, North York M3A 1R3, Canada.
Reprint requests to: Armauer Hansen Research Institute, P.O. Box 1005, Addis Ababa, Ethiopia.
Received for publication on 30 November 1993.
Accepted for publication in revised form on 13 June 1994.